 Marina Lyubimova

⬤ On-chain analysis of Ethereum is drawing serious attention right now. A chart tracking "Ethereum: On-Chain Price Dynamics" maps how ETH has historically reacted to a set of blockchain-derived valuation bands - realized price, investor price, average price, delta price, and the long-term cycle top. Together, these levels offer a structured way to read where Ethereum stands in its broader market cycle.
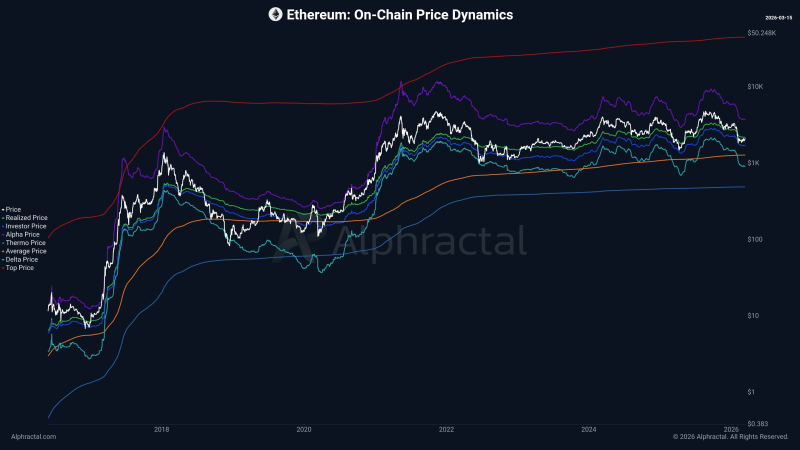
⬤ The most-watched of these is the Realized Price, currently sitting near $2,191, which is acting as overhead resistance. This metric reflects the average cost basis across all coins based on their last on-chain transaction. When ETH trades below it, a significant share of holders are sitting on unrealized losses - a condition that historically weighs on sentiment and creates selling pressure.
These levels currently serve as key reference points for understanding Ethereum's broader market structure.
⬤ Below that, the Investor Price near $1,700 has proven its relevance twice over - it defined the market bottom in January 2026 and served as support at several points during 2025. Deeper still, the Average Price around $1,278 historically marked extreme fear zones whenever ETH dropped below it. The Delta Price near $917 represents the floor of floors - the level that has marked the ultimate cycle bottom across multiple Ethereum bear markets.
⬤ These on-chain bands don't stay static. As blockchain activity evolves, all four reference levels gradually shift alongside investor behavior. That dynamic quality is exactly what makes them valuable - they reflect real capital flows rather than arbitrary chart lines. Recent work on Ethereum's $3,800-$4,000 liquidity zone shows how these valuation frameworks interact with technical structure and liquidation clusters during volatile market phases, giving analysts a more complete picture of where ETH is likely to find support or face resistance.
 Marina Lyubimova


