Victoria Bazir

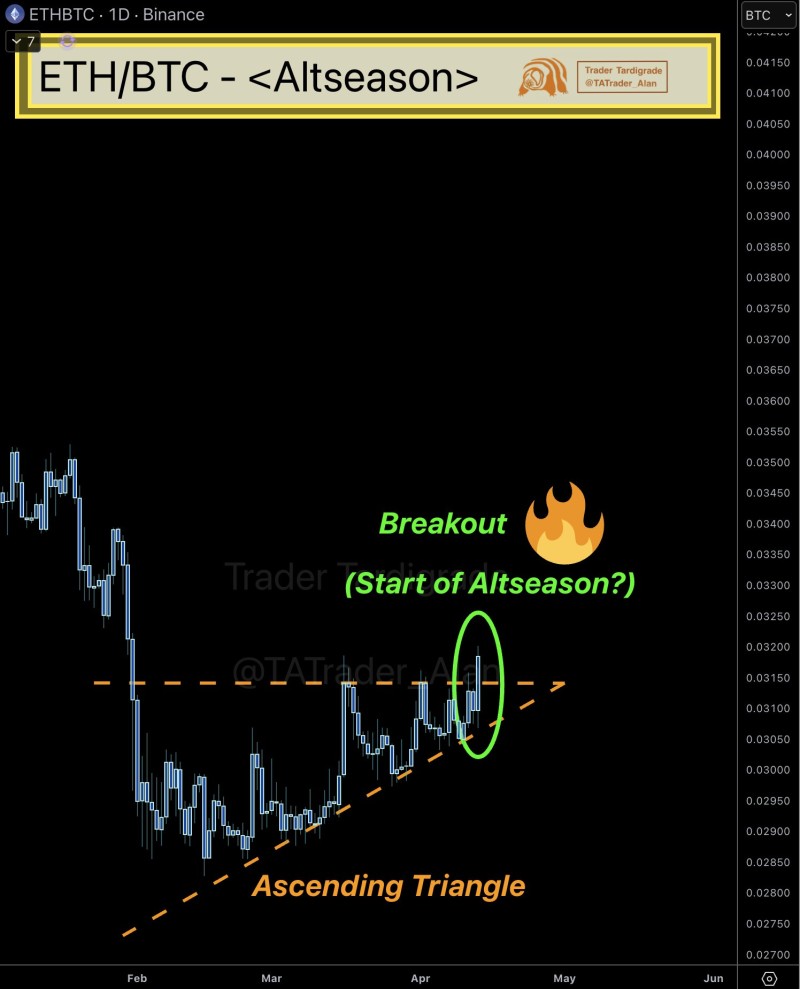
A breakout is beginning to take shape on the ETH/BTC chart, where Ethereum is attempting to push above a multi-month resistance zone near the 0.031 area against Bitcoin. The move is drawing serious attention from traders, with Trader Tardigrade pointing to this pattern as one of the final formations emerging from the broader bear market phase.
The chart shows a clear ascending triangle structure defined by rising lows and a flat resistance ceiling that has held for several months. This kind of setup typically reflects gradual accumulation - buyers continue stepping in at higher levels while sellers defend a consistent ceiling, compressing price into a tightening range that usually precedes a sharp expansion.
ETH/BTC Ascending Triangle: How the Structure Built
Price action has been compressing into this formation since early-year lows, with each pullback finding support at a higher point along the rising trendline. That sequence of higher lows against a flat resistance zone is the defining feature of an ascending triangle, and it carries a straightforward implication - sellers are gradually losing control of the ceiling they've been defending.
The structure remained intact through multiple failed breakout attempts, each of which reinforced rather than invalidated the pattern. Every test that was turned back simply reset the setup for another approach, and the trendline support held through each one.
ETH/BTC Breakout Zone: Where the Move Is Happening
The latest candles show price pushing into and slightly above the upper boundary of the triangle, marking the first meaningful expansion beyond resistance after several failed tests. The breakout attempt is now underway, and the area around 0.031 has become the key zone to watch for confirmation.
Ethereum Breaks Multi-Year Downtrend Against Bitcoin - Altseason Incoming? - similar breakouts in ETH/BTC have previously marked the start of large-scale shifts in market leadership, which is part of why this moment is getting so much attention.
The structure remains valid as long as price continues to hold above the rising trendline that has supported the move from the beginning. A clean close above the resistance zone would add meaningful weight to the bullish case, while a return below the trendline would put the pattern back in question.
Ethereum vs Bitcoin: A Signal for the Broader Altcoin Market
The ETH/BTC pair has long been treated as a leading indicator for broader crypto market rotation. When Ethereum begins to outperform Bitcoin, it tends to signal capital moving into higher-risk assets across the altcoin space - a dynamic that has played out repeatedly across previous cycles.
Long-term cycle behavior supports this reading, as breakouts in ETH/BTC have historically coincided with periods of altcoin outperformance, a theme covered in depth in Ethereum vs Bitcoin: 2025 Could Mark a Historic Shift.
Broader sentiment around altcoins has been strengthening alongside this setup, with market narratives increasingly pointing toward an altseason phase. The conditions shaping that outlook are examined in Altseason 2025: Are Altcoins Poised for Their Biggest Rally Yet?
If the breakout holds, ETH/BTC could mark the beginning of a shift in relative strength - one that extends beyond Ethereum and into the wider altcoin market.
The structure is now at a pivotal point. Confirmation here would suggest the start of a broader trend shift. Rejection would push the pattern back into compression and delay the rotation trade. Either way, the next few candles on the ETH/BTC chart will carry more weight than usual for anyone watching the altcoin space.
 Victoria Bazir