 Saad Ullah

Ethereum is now positioned at a pivotal structural level after a multi-cycle move, revisiting the origin zone of its previous impulse. As Lennaert Snyder noted, this area represents both a range extreme and a key support region - where the strongest risk-reward setups typically form. The chart highlights a high-risk, high-reward area where a bullish reaction could lead to a larger expansion phase.
Where the Previous ETH Impulse Began
The chart shows ETH returning to the "sell-to-buy" candle that initiated the move toward its all-time high. This zone marks a transition point where price previously shifted from selling pressure into strong upward momentum.
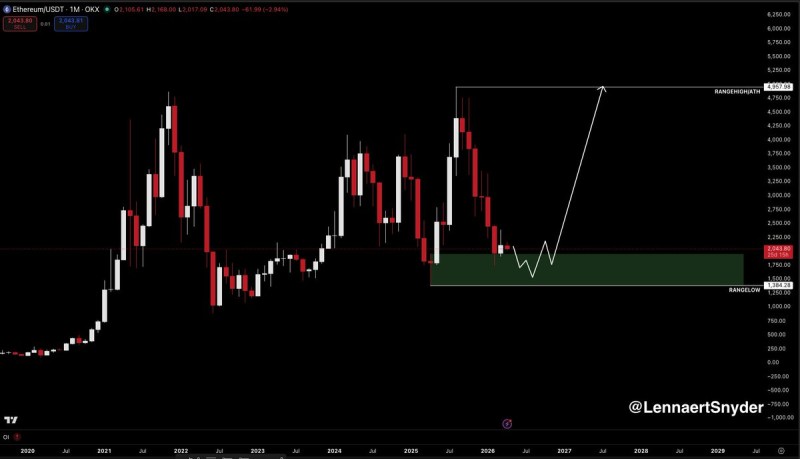
This is not a random revisit - it is a retest of the exact level that triggered the prior expansion.
A defining feature here is the large wick left behind during that move. Such wicks tend to be revisited over time as they act as liquidity magnets. Price is now testing that wick, bringing the market back to the same structural origin.
Ethereum Positioned at Range Extremes
The broader structure reflects range behavior, with ETH trading near the lower boundary. In range trading, the most attractive setups typically appear at extremes rather than mid-range. The current zone aligns with a key accumulation area between roughly $1,400 and $1,800, where price stabilizes after rejection from higher levels - as covered in Ethereum Maps Cycle Path Toward $20K as Accumulation Zone Holds.
This positioning creates clear asymmetry:
- Downside risk is compressed near support
- Upside potential stretches toward the upper boundary of the range
- Range extremes historically offer the highest reward-to-risk entries
In range environments, the most important moves tend to begin exactly where price is now: at the extremes.
The Wick That Draws ETH Liquidity
The long wick highlighted on the chart is central to the setup. Such wicks are often retested because they attract liquidity - ETH is now interacting with that wick, effectively probing whether buyers will step in at the same level that previously sparked a major rally. This behavior is consistent with broader Ethereum technical patterns discussed in Ethereum Tests $2,000 Support in Multi-Year Ascending Channel, where repeated tests of support zones signal absorption and potential accumulation rather than immediate breakdown.
The Reaction That Will Define the Next ETH Move
The chart does not confirm a breakout - it outlines a conditional scenario. If ETH shows a bullish reversal from this zone on higher timeframes, it could mark the beginning of a larger upward move toward the range high. If not, price remains within the range structure.
This area represents both a range extreme and a key support region - where the strongest risk-reward setups typically form.
Similar compression and indecision phases have been observed around the $2,000 region, where Ethereum trades between support and resistance before a decisive move emerges - a dynamic explored in depth in ETH Holds $2,000 as Breakout or Breakdown Nears. For now, Ethereum is not trending - it is testing. And that test is happening at exactly the level that matters most.
 Saad Ullah


