 Usman Salis

Ethereum is drawing fresh attention as price action settles around a well-established support zone. On the weekly chart, ETH has bounced off a long-term ascending trendline and is now trading sideways near the $2,000 level. The consolidation reflects a pause in selling pressure after a broader corrective phase, with price holding rather than breaking below a historically significant floor.
$2,000 Zone Holds as Key Structural Support
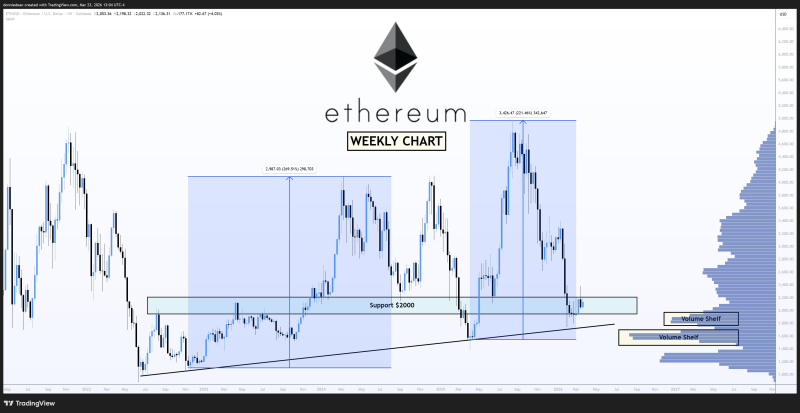
The weekly structure shows ETH reacting from the rising support line and entering a tight range near $2,000. This area lines up with visible volume clusters, reinforcing its technical importance. Ethereum faces $2,080 resistance as downside liquidity lures action, with price continuing to consolidate at $2,000 while liquidity zones below remain in focus. Holding this level is the central question for traders watching the current setup.
Historical Pattern Suggests 200% Upside From This Base
What makes the current setup noteworthy is the historical context. Past rebounds from comparable support structures produced gains of around 200%, suggesting ETH may be forming a launchpad rather than a prolonged base. Cycle comparisons point to oversold conditions preceding strong directional moves, and Ethereum rebounds above $2,000 micro support toward $2,150 confirms that holding this zone has already triggered short-term recovery momentum in recent weeks.
The broader picture for ETH remains defined by the $2,000 level. Continued consolidation above it signals market stabilization, while a clean break and hold would set up the next expansion phase. Until then, how price interacts with this support will shape near-term sentiment and determine whether the historical 200% pattern begins to replay.
 Usman Salis


