 Marina Lyubimova

Market analyst DrBullZeus flagged the tightening ETH structure, pointing to these two levels as the boundaries that will define the next directional move. Ethereum is no longer trending - it's coiling. After a sharp selloff from above $2,060, price action has shifted into a narrowing range, and a volatility expansion looks increasingly likely.
ETH Triangle Compresses After Sharp Selloff
The chart tells a clear story: a strong impulsive drop, followed by consolidation rather than recovery. Instead of reclaiming lost ground, ETH is stabilizing within a tightening structure - forming lower highs against a descending trendline and higher lows from rising support.
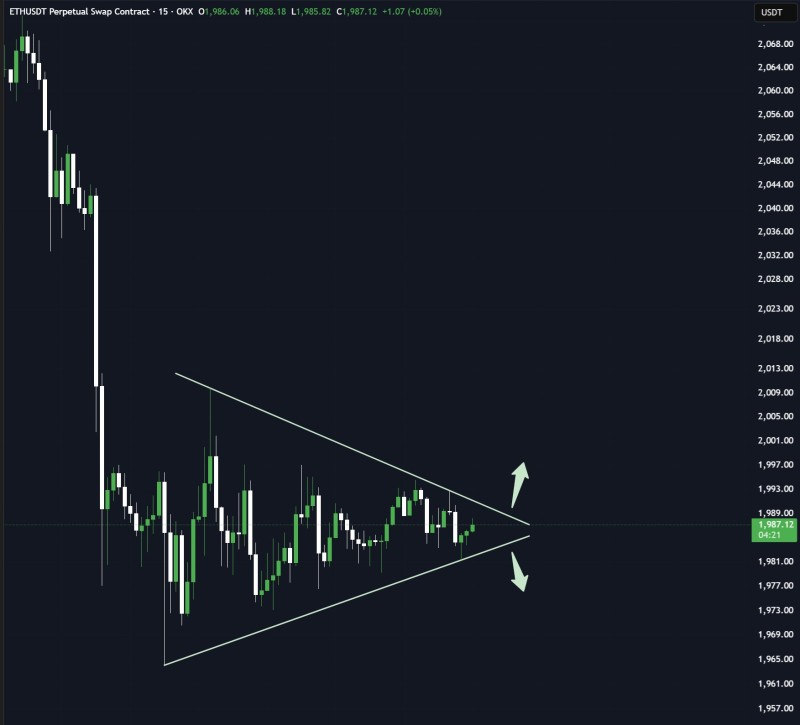
That's a textbook symmetrical triangle. It reflects a temporary equilibrium between buyers and sellers, and these setups tend to resolve with a sudden directional break once one side runs out of patience.
Price is compressing. The triangle is nearly exhausted. A breakout is coming - the only question is which direction.
Similar compression patterns have recently appeared across ETH charts, where tightening ranges preceded sharp moves once key levels cracked.
ETH Triangle: $2,015 Resistance and $1,965 Support Define the Range
The structure is well-defined. Two levels matter right now:
- Resistance near $2,015 - multiple attempts to push higher have been capped here
- Support rising toward $1,965 - buyers have consistently stepped in at this level
Price is now trading near the apex, meaning the range is almost fully exhausted. At this stage, continuation inside the triangle becomes unsustainable - and a breakout becomes more probable with every candle. ETH has also failed to print a higher high since the initial drop, which keeps bullish momentum in check despite the consolidation.
The levels are straightforward - but the implications are not.
What Ethereum's Triangle Structure Signals for the Next Move
The behavior inside this triangle reflects indecision rather than strength. Buyers are absorbing dips without the conviction to break resistance. Sellers, meanwhile, are no longer pushing aggressively lower - suggesting exhaustion on both sides.
This type of structure often acts as a continuation pattern within a broader trend. Given that the prior move was bearish, the risk of a downside resolution stays elevated unless $2,015 is decisively cleared.
Ethereum is not offering signals right now. It is building pressure.
As recent technical coverage of ETH noted, the market is waiting, not trending - until a clean break defines direction.
The Break That Will Define Short-Term Direction
The next move won't be subtle. A breakout above $2,015 would invalidate the sequence of lower highs and open the door to a short-term recovery. A breakdown below $1,965 would confirm the prior bearish move is continuing - and likely trigger an acceleration to the downside.
Ethereum is coiled. Whichever side breaks first is likely to set the short-term trend.
Recent Ichimoku analysis also flags breakdown risk building near the $2,000 zone, adding technical weight to the lower boundary of this triangle.
 Marina Lyubimova


