 Sergey Diakov

Something interesting is happening on Dogecoin (DOGE) daily chart. Price has returned to a support zone that held firm during the summer, and the Relative Strength Index is showing a pattern almost identical to what we saw before July's big move. When price structure and momentum indicators line up like this, it often signals a potential trend reversal. Traders are now watching to see if DOGE will repeat its earlier performance.
What the Chart Is Showing
The current setup combines two key elements: DOGE sitting on strong support and the RSI breaking through a downtrend line.
Both of these happened right before the last major rally.
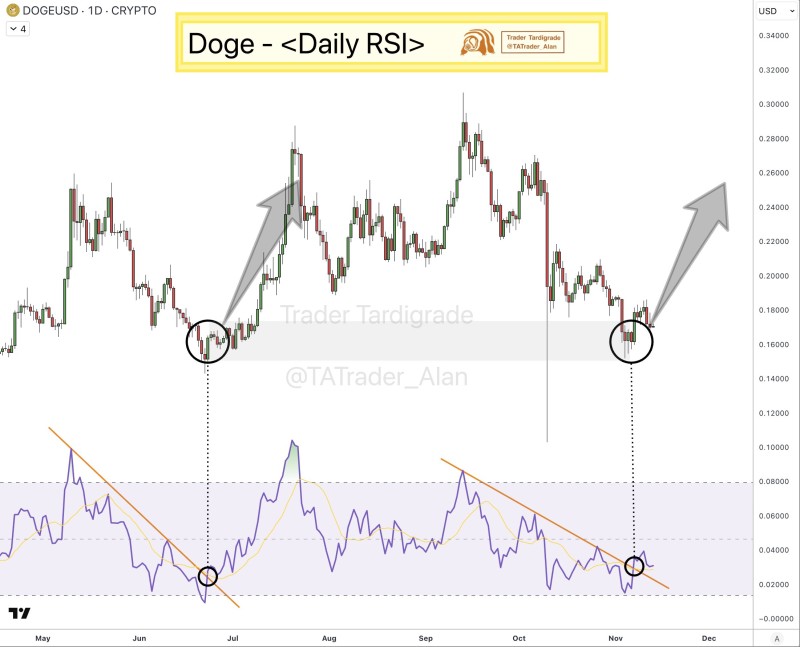
- Support Zone Holding Again: Dogecoin is consolidating between $0.16 and $0.18, the same area that launched the summer rally. Price action looks similar to before — small candles forming at the bottom, buyers stepping in to defend the level, and a clear low forming at support. This zone has proven to be a reliable launchpad in the past.
- RSI Breaking Its Downtrend: The momentum indicator has pushed above a descending trendline, mirroring what happened in July. The pattern is remarkably similar: RSI was trending down, hit a low, broke through resistance, and price followed with a strong move up. The chart even marks these matching elements with circles and arrows to highlight the symmetry.
- Potential Upside Path: If support holds and momentum continues building, the chart suggests DOGE could follow a similar upward trajectory. There's no specific resistance target drawn, but the implication is clear — conditions are aligning for a potential move higher.
Why This Setup Matters
Market conditions: Overall crypto sentiment is improving as traders rotate back into risk assets. Momentum shift: RSI often turns before price does, making these trendline breaks significant early signals. Historical performance: DOGE has repeatedly rallied from this support zone, and accumulation patterns are forming again. Pattern recognition: When charts repeat recognizable structures, both traders and algorithms tend to respond, often creating self-fulfilling momentum.
Levels to Watch
If bulls stay in control, holding $0.16–$0.18 keeps the pattern intact, while RSI staying above its trendline confirms strengthening momentum. A push toward $0.21–$0.24 becomes realistic if volatility picks up. On the flip side, dropping below $0.16 would break the pattern and potentially trigger deeper selling. Losing the support zone entirely could lead to a retest of lower levels.
Final Thoughts
Dogecoin is showing a technical setup that looks a lot like what we saw before the last rally. Support is holding, momentum is shifting, and the pattern is repeating itself. While nothing is guaranteed until we see clear follow-through, the pieces are falling into place for a potential move up. With volatility returning and sentiment improving across crypto, this could be another turning point for DOGE worth paying attention to.
 Sergey Diakov


