Saad Ullah
Dogecoin's long-term price behavior has become one of crypto's most recognizable cyclical patterns. Every few years, DOGE forms a rounded bottom, stabilizes inside a rising channel, produces several premature upside deviations, and eventually accelerates into a steep vertical phase. The current chart shows this structure repeating with remarkable accuracy, suggesting Dogecoin may be entering a crucial period that could define its next major trend.
Dogecoin Follows Familiar Long-Term Pattern
Dogecoin is once again mirroring the same multi-year structure that has defined each of its major market cycles.
The latest monthly chart shows DOGE steadily building within an ascending channel while forming recurring deviations above resistance — a setup that has historically preceded sharp upside expansions. The long-term pattern remains intact and may be preparing for its next phase.
Chart Analysis: Channel Structure Shows Building Pressure
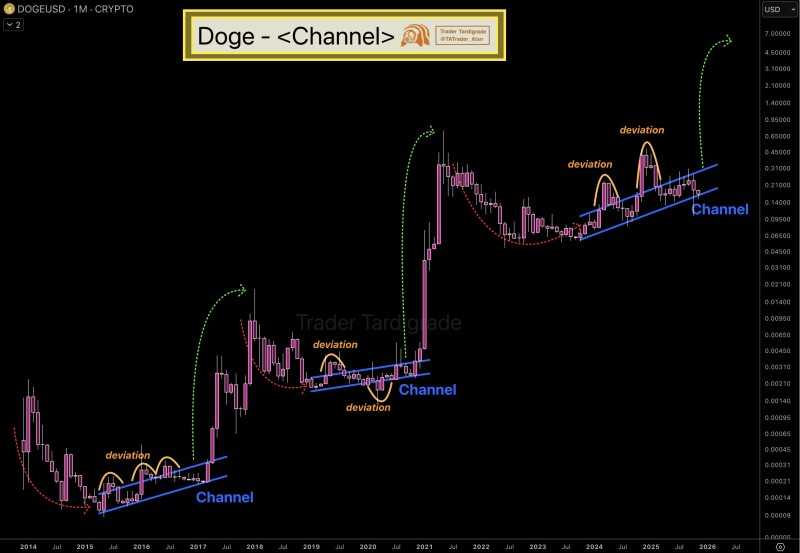
The monthly chart spans nearly a decade of DOGE price history and highlights a recurring three-stage formation: accumulation, channeling, and parabolic expansion. Every cycle displays almost identical technical behavior:
DOGE Remains Inside a Rising Channel (2022–2025)
The right side of the chart shows Dogecoin trading cleanly within a blue ascending channel. The lower trendline acts as stable long-term support, while the upper trendline has been repeatedly tested but not sustainably held. Several temporary moves above the channel (marked in orange) match the pattern seen in prior cycles. These deviations are a critical feature of DOGE's historical behavior — they tend to occur shortly before a significant expansion phase.
Prior Cycles Show Nearly Identical Structure
The chart clearly presents two earlier cycles with the same formation. From 2015 to 2017, there was a rounded bottom, channel formation, deviation, and strong rally. The 2018–2020 cycle showed a rounded bottom, channel, deviation, and the explosive 2021 surge. Now the 2022–2025 cycle displays a rounded bottom, channel formation, multiple deviations, and current buildup. The dotted green arrows illustrate the scale of previous vertical expansions, implying that the current consolidation may be the final stage before volatility increases.
Rounded Bottom Pattern Still Intact
The red curved lines on all three cycles show rounded bottom formations. Dogecoin currently displays the same curve from mid-2021 through 2023, confirming a maturing long-term base. The chart lacks volume data, so conclusions rely purely on price behavior. However, the consistency of the pattern across nearly a decade strengthens its reliability.
Why Dogecoin Continues to Mirror Its Previous Cycles
Several factors contribute to this recurring pattern. DOGE remains one of crypto's most emotionally driven assets, often experiencing powerful waves of retail interest during bullish macro periods. Historical surges in DOGE price have coincided with broader crypto liquidity inflows, particularly surrounding Bitcoin halving cycles. Dogecoin also benefits from an unusually strong meme culture, making it prone to sudden sentiment-driven rallies. Additionally, ongoing discussions about payments integration and network improvements maintain long-term investor curiosity.
 Saad Ullah