 Saad Ullah

⬤ Dogecoin's weekly chart suggests the cryptocurrency might be wrapping up an extended pullback pattern that's played out before. The current setup looks remarkably similar to earlier cycles where DOGE went through multi-phase corrections before jumping into stronger upward movement. These rounded corrective waves have shown up multiple times in the past, right before major price expansions kicked in.
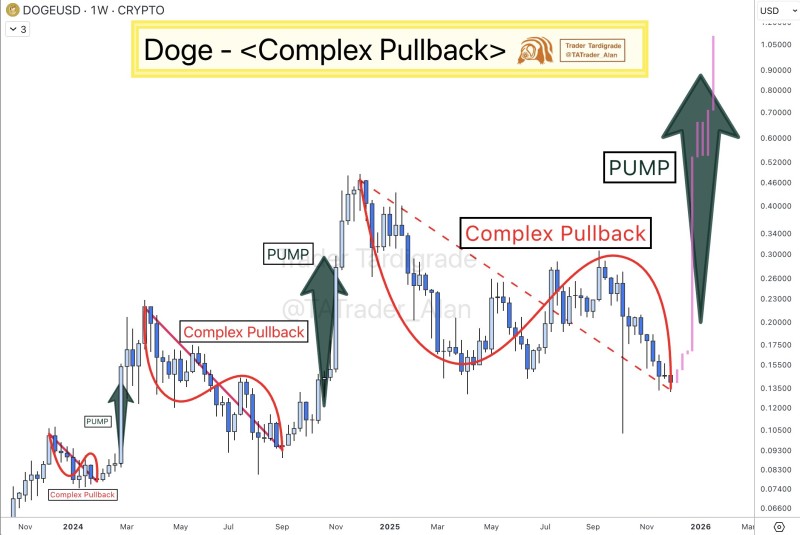
⬤ Looking at the chart, you can spot several earlier complex pullbacks that were followed by strong rallies in early 2024 and mid-2025. Each time, these moves came after a curved correction phase. Right now, the price action is hanging near the lower edge of the pullback arc, forming exactly the kind of structure that came before previous acceleration points.
⬤ The chart shows a projected upward move, suggesting potential bullish continuation if this pattern wraps up like the previous ones did. While there aren't specific price targets mentioned, what stands out is how cyclical Dogecoin's movements have been and how closely the current setup matches those earlier patterns.
⬤ This is worth paying attention to because these long-term weekly patterns have historically shaped DOGE's bigger trend moves. If the asset breaks out of this pullback zone, it could shake up sentiment around meme coins and prove once again that these technical patterns actually matter. Traders will be watching closely to see if Dogecoin follows its usual playbook this time around.
 Saad Ullah


