 Eseandre Mordi

Dogecoin has delivered an impressive rally after flashing a key technical signal that caught traders' attention. The meme coin's price action turned sharply bullish following an Ichimoku indicator cross, pushing DOGE into a critical resistance zone where its next move could determine the trend's sustainability.
DOGE Posts 34% Surge Following Technical Breakout
Dogecoin experienced a dramatic price surge after a bullish signal emerged on shorter timeframes. The 4-hour chart revealed a Tenkan-sen and Kijun-sen bullish cross within the Ichimoku system. This technical development triggered a roughly 34% climb in DOGE's price, marking one of the token's strongest single moves in recent weeks.
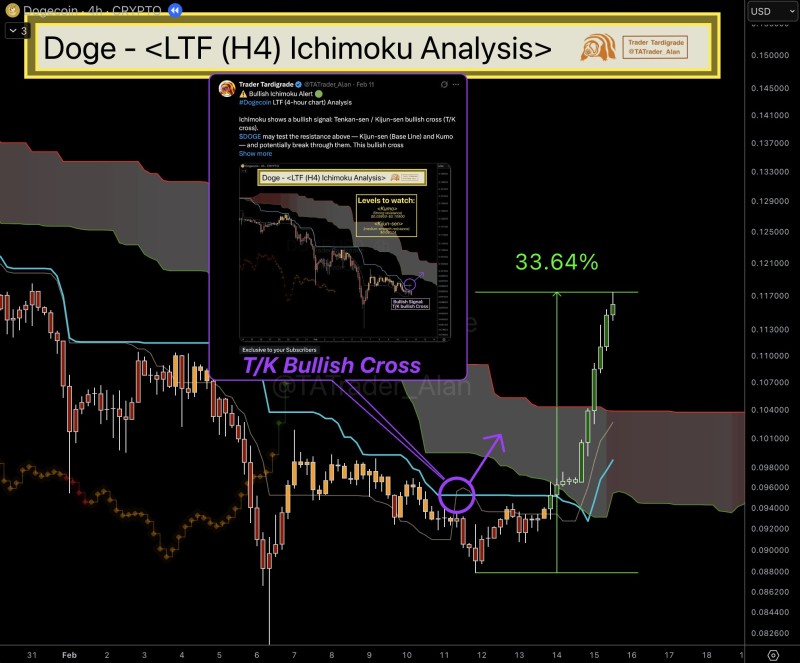
The rally began from a consolidation phase where DOGE had been trading sideways beneath the Ichimoku cloud. Once the breakout occurred, candles pushed aggressively higher, carrying the price through multiple resistance levels before approaching the upper boundary of the cloud structure. This move aligns with typical bullish breakout targets in similar technical setups.
Critical Resistance Zone Ahead on Daily Timeframe
While the 4-hour chart signaled bullish momentum, the daily timeframe presents a different picture. DOGE is now testing resistance aligned with the daily Ichimoku cloud—a zone that often acts as a significant barrier for continued upside.
The Ichimoku framework is designed to track trend structure alongside dynamic support and resistance zones. The current setup shows a clear conflict: short-term bullishness meeting higher-timeframe resistance. How DOGE behaves at this level will likely determine whether the rally extends or stalls.
What's Next for Dogecoin?
This moment represents a pivotal technical crossroads for Dogecoin. The interaction between the intraday bullish signal and the daily cloud resistance could define the token's trajectory in the coming sessions.
If DOGE manages to break through the daily cloud resistance, it could open the door for another leg higher, potentially targeting the next major resistance zone and signaling a potential breakout continuation. However, failure to clear this level might lead to consolidation or a pullback as bulls lose momentum against the stronger timeframe's barrier.
Traders watching DOGE should monitor volume, candle closes relative to the cloud, and whether the 4-hour Ichimoku structure remains supportive during any retest. The coming days will reveal whether this 34% rally is just the beginning or a short-term spike meeting its limits.
 Eseandre Mordi


