 Saad Ullah

⬤ Dogecoin just closed a daily candle that completed what looks like a textbook double bottom pattern on the chart. The setup shows two distinct lows clustered around the $0.12 zone, followed by a bounce that traders are watching closely. Right now, DOGE is testing a neckline resistance sitting near $0.132, and the market is waiting to see if buyers can push through.
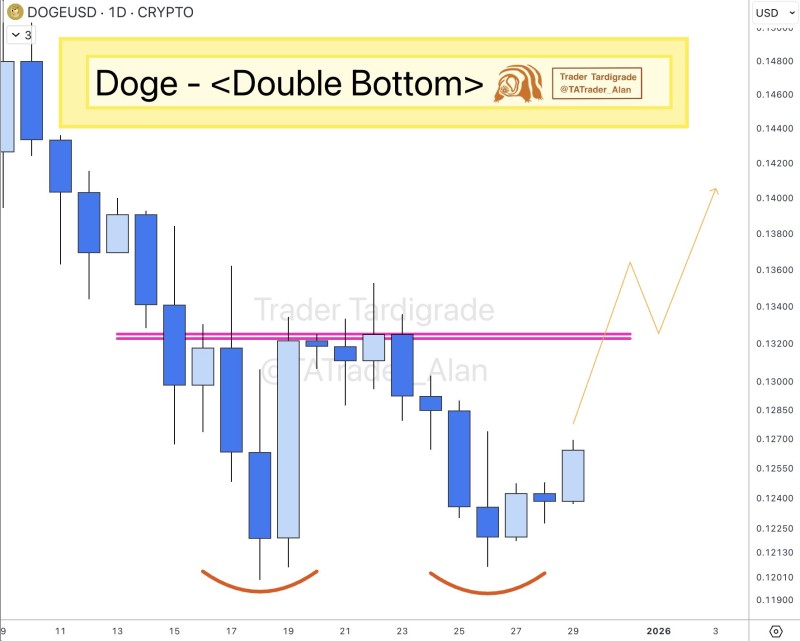
⬤ The chart tells the story pretty clearly—DOGE spent most of early December sliding downward before finding solid ground around $0.12. That level held twice, creating those two rounded bottoms that define the pattern. The neckline area is marked as the key zone to break, and recent candles show a modest recovery effort building from those lows. It's classic double bottom behavior, though nothing's certain until it actually breaks out.
⬤ The current structure suggests selling pressure might be cooling off, at least for now. If DOGE manages to push above that neckline, the chart hints at potential upside movement ahead. But for the moment, price action is still dancing below resistance. This comes after a rough stretch across crypto markets in general, so any stabilization is worth noting.
⬤ What makes this pattern interesting is that it shows sentiment might be shifting from steady downside pressure to something more balanced. If Dogecoin holds above these recent lows and keeps testing resistance, it could help rebuild some short-term confidence. But if support breaks down, the downside risk kicks right back in. Like always with crypto, volatility is part of the package, and DOGE is still trading in a pretty sensitive zone.
 Saad Ullah


