 Usman Salis

⬤ Dogecoin is catching traders' attention as a tightening price pattern on the 1-hour chart points to a possible breakout. According to @alicharts, DOGE might be breaking out of a triangle formation—a setup that typically leads to sharp price moves once consolidation ends. The chart shows Dogecoin trading around $0.123 after several sessions of shrinking volatility.
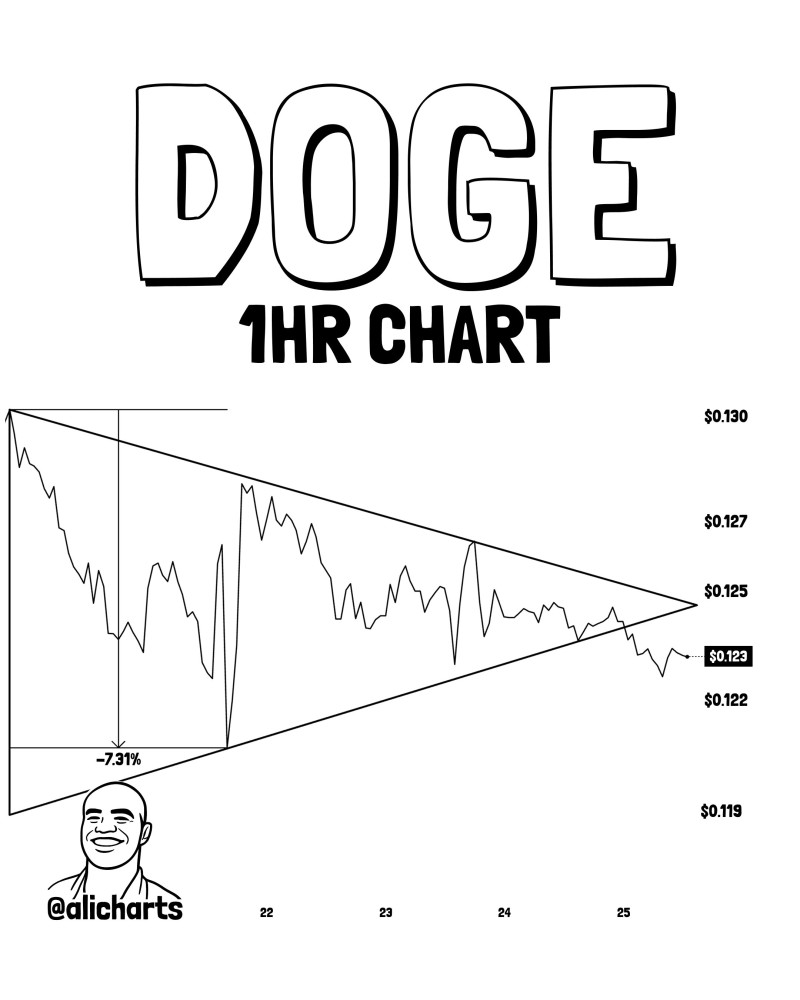
⬤ The symmetrical triangle formed after a 7.3% drop earlier in the period. Since then, price action has been squeezed between converging trendlines, with buyers and sellers locked in a tight range. The upper boundary sits near $0.125 to $0.127, while support holds just above $0.122.
⬤ When price gets squeezed like this, it usually means something's about to give. DOGE is approaching the triangle's apex, which is typically where the market picks a direction. Based on the measured move from the pattern, a breakout could deliver roughly 7% in either direction. The clock is ticking as price action nears this decision point.
⬤ This matters because Dogecoin tends to react strongly after tight consolidation periods. A clean breakout could spark momentum across the meme coin sector, while a rejection might extend the current sideways action. With DOGE sitting at a technical crossroads, how this pattern resolves will likely set the tone for the next move.
 Usman Salis


