 Usman Salis

Dogecoin's structure is tightening after an extended downtrend, with price now positioned near a critical resistance zone. Crypto analyst Jonathan Carter at @JohncyCrypto noted that the current formation suggests a breakout attempt may be approaching, with bullish pressure gradually building inside the channel.
Where the Dogecoin downtrend meets its limit
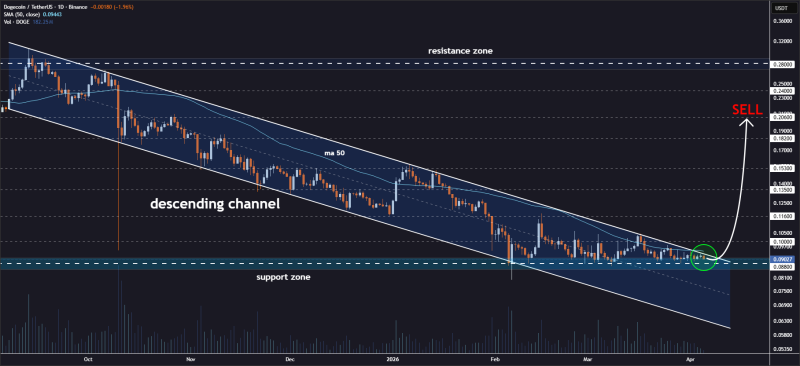
The chart shows a clearly defined descending channel, with DOGE consistently forming lower highs and lower lows. This structure has controlled price action for months, with each rally capped by the upper boundary.
The current formation suggests a breakout attempt may be approaching, with bullish pressure gradually building inside the channel.
Now, price is testing that same boundary again after a prolonged period of sideways movement near support. This type of tightening behavior is consistent with broader Dogecoin technical patterns, where price compresses between resistance and support before a larger move.
Support holds while Dogecoin resistance weakens
A key support zone sits around the $0.088-$0.090 region, where price has stabilized. This level continues to hold, preventing further downside continuation.
At the same time, DOGE is no longer making aggressive lower lows. Instead, price is consolidating while gradually approaching resistance. This reflects a classic compression structure where volatility contracts before expansion - often signaling that a breakout move is approaching.
Price is no longer trending sharply lower - it is stabilizing beneath resistance, with the 50-day moving average reinforcing that bearish momentum is weakening rather than accelerating.
The 50-day moving average remains close to price, reinforcing the idea that bearish momentum is weakening rather than accelerating.
The DOGE levels that define the $0.206 upside path
If DOGE breaks out of the channel, the chart outlines a sequence of resistance levels:
- $0.100 as the first breakout confirmation
- $0.116 and $0.135 as intermediate resistance zones
- $0.153 and $0.182 as continuation levels
- $0.206 as the upper resistance target
These targets align with visible horizontal zones on the chart and represent the full upside path if the breakout is confirmed. Traders can reference the 0.786 Fibonacci and long-term support confluence analysis for additional context on key levels.
A market shifting from decline to compression
The key structural shift is from trend to compression. DOGE is no longer trending sharply lower - it is stabilizing beneath resistance.
The structure now suggests that the next move is less about continuation - and more about resolution. As long as support holds while resistance is tested, the probability of a breakout increases.
This type of setup reflects a market in equilibrium, where pressure builds between buyers and sellers before a decisive move defines direction. As long as price continues to hold support while testing resistance, the probability of a breakout increases. The structure now suggests that the next move is less about continuation - and more about resolution.
 Usman Salis


