Peter Smith

⬤ Cardano's stuck in a messy technical spot right now, with recent price movement offering little clarity on where it's headed next. On the 30-minute ADA/USD chart, price is consolidating around $0.358 after taking a sharp dive earlier this week. The current micro structure remains choppy, with overlapping swings and no clean impulsive move to confirm either a real recovery or a decisive drop lower.
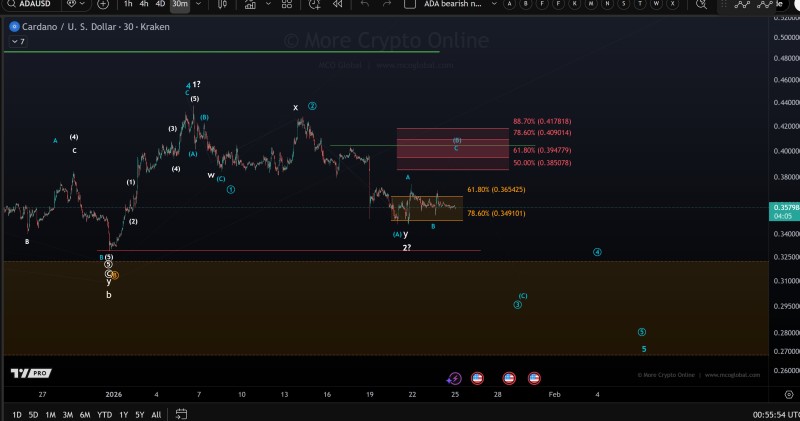
⬤ The chart shows an upside scenario where a sustained push above $0.374 would suggest that wave c of a broader corrective wave (B) is still playing out. This level sits above the current range and lines up with Fibonacci retracement zones marked between roughly $0.385 and $0.409. A move into this area would fit the blue-labeled scenario on the chart, meaning the larger B-wave correction is still active rather than finished.
⬤ On the downside, $0.346 marks a critical level corresponding to this week's low. A break below that point would favor a more direct continuation lower, with the next likely test near $0.329. In that case, the chart suggests blue wave (A) may still be extending rather than already completed. The lack of a clear five-wave advance from current levels weakens confidence in the alternative white scenario, which remains unreliable without impulsive upside confirmation.
⬤ This setup matters for the broader market because Cardano's positioned at a point where short-term volatility could spike once price resolves from its current range. Unclear micro structures often come before sharp directional moves when key levels get tested. How ADA behaves around $0.374 on the upside or $0.346 on the downside will likely shape near-term sentiment, while the larger corrective B-wave scenario continues guiding expectations until clearer structure emerges.
 Peter Smith