Peter Smith

A key on-chain Bitcoin metric has returned to a zone traders rarely see. Only 58.7% of BTC supply is currently in profit, according to the chart, with similar readings highlighted around 2015, 2018, and 2022. As Rand Group noted, the setup echoes prior periods when market stress pushed profitability sharply lower.
A Return to the Lower End of the BTC Profit Range
The chart tracks Bitcoin price against the share of circulating supply that remains in profit. Historically, the upper end of the range sits near 90%, while the lower stress zone is clustered around 45% to 60%. The current reading of 58.7% places BTC back inside that lower band - not far above the chart's 45% reference line and below the 60% threshold marked on the right axis.
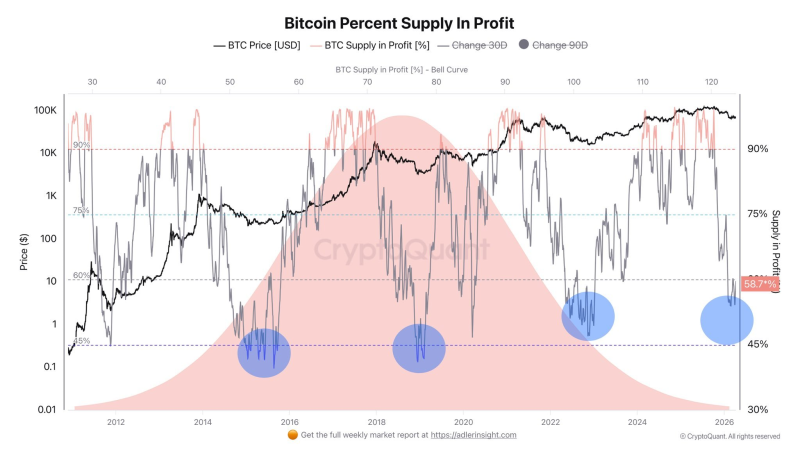
That matters because the metric has not simply drifted lower. It has moved back into a range that coincides with prior periods of broad market pain rather than late-stage euphoria. The source specifically points to 2015, 2018, and 2022, and the visual layout reinforces those dates with highlighted circles near the lower part of the cycle range.
The Three Historical BTC Cycle Echoes on the Chart
What makes the setup stand out is repetition. In each of the three highlighted periods, Bitcoin supply in profit compressed into the same broad zone before the market eventually moved into a different phase. The recurring structure across the full cycle history is the main signal:
- Profitability falls sharply during major drawdowns
- The metric stabilizes in the lower band
- The same area has appeared only a handful of times across the full cycle history shown
Bitcoin On-Chain Losses Signal the Bottom Isn't In Yet provides on-chain context that complements the supply-in-profit reading, showing how realized losses across the network have been building in a pattern consistent with the stress zones the chart is now revisiting.
Why This BTC Reading Stands Out Now
The current level is notable because Bitcoin price remains far above earlier cycle lows in absolute dollar terms - yet profitability has still compressed enough to push the supply-in-profit metric back into a stress zone. This is not a chart about price alone. It is about how much of the market is still comfortably above cost basis.
BTC Hovers Near $80K as Miner Stress Signals Potential Local Bottom captured an earlier stage of the on-chain stress building across the network, showing how miner economics and supply profitability have been deteriorating in parallel. BTC Shows Ongoing Bottom Formation as 30DMA Signals No U-Shape Recovery adds further context on the price structure side, reinforcing that the on-chain stress visible in the supply-in-profit metric is being reflected in the chart behavior as well.
 Peter Smith