 Usman Salis

⬤ Bitcoin is trying to find its footing after a brutal drop that sent it crashing into lower support zones. Recent price action is flashing early recovery signs, and there's been solid inflow into Bitcoin ETFs helping lift the mood. The daily chart shows BTC bouncing from the high-$70K area after breaking down hard from its previous trading range.
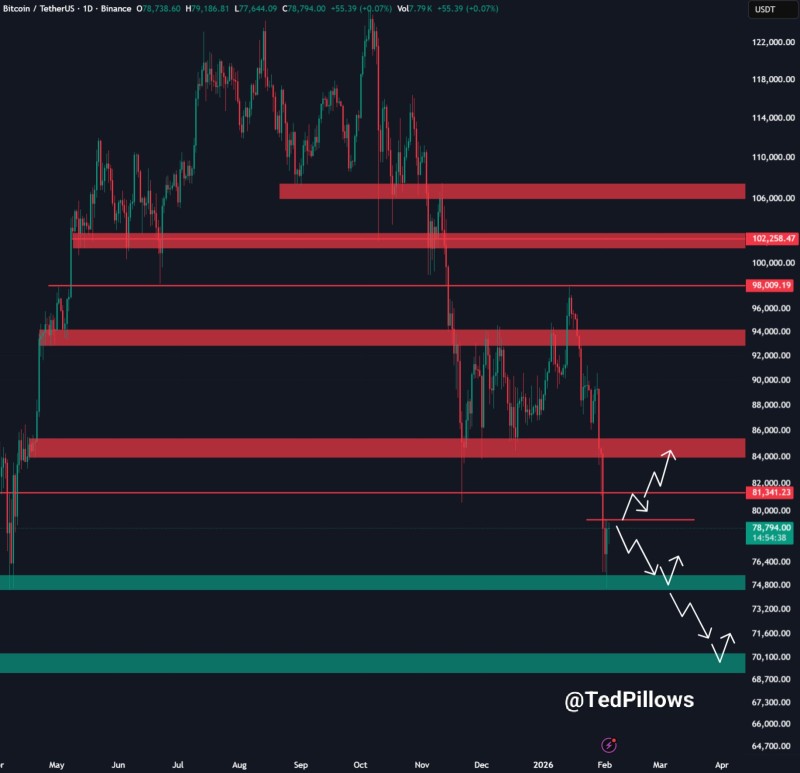
⬤ BTC gave up major support levels at $102K and $98K, and now those zones are working against it as resistance. Price is sitting below the $80K mark, which has become the make-or-break level right now. If Bitcoin can push above $80K and hold it, that would flip the script and open up a run toward $84K–$85K resistance—an area that lines up with a CME gap on the chart.
⬤ Even with the bounce, the overall setup is still shaky. Bitcoin is trading under multiple resistance bands left behind from the selloff, and the chart shows a clear pattern of lower highs after breaking down from above $90K. Bulls have defended the mid-$70K zone so far, but if $80K doesn't get reclaimed soon, BTC could get stuck grinding sideways or face another leg down.
⬤ This matters for the whole crypto market because Bitcoin usually leads the pack. ETF inflows show institutional money is coming back in, but price needs to confirm it. A clean break above $80K would boost sentiment and strengthen the recovery case toward higher resistance zones. Until that happens, Bitcoin is in a sketchy spot technically, and where it goes next depends on what happens at this key $80K level.
 Usman Salis


