 Usman Salis

⬤ Bitcoin has been grinding sideways for weeks now, repeatedly testing major trend lines without making any real progress. The weekly chart shows BTC struggling near current levels after multiple failed attempts to push higher, and momentum indicators are looking pretty weak. Traders are watching the weekly 200-MA closely - it's become the line in the sand for determining what happens next.
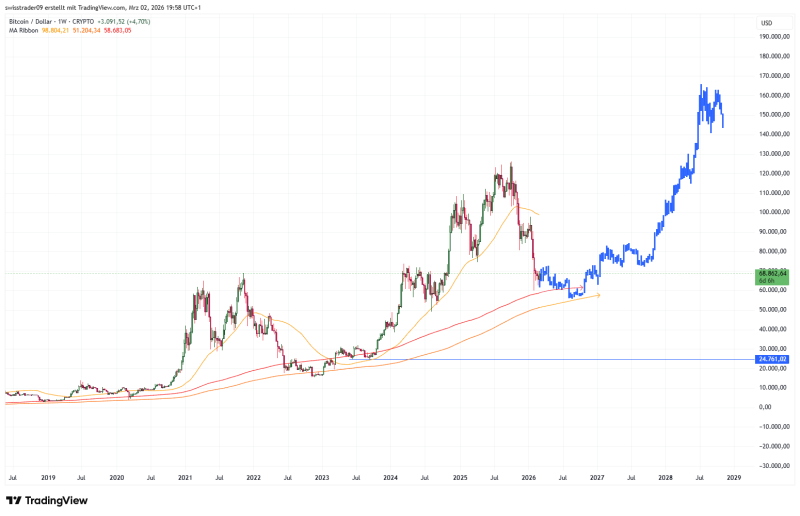
⬤ The chart tells an interesting story. Price keeps bumping into resistance and falling back, unable to lock in a convincing higher high. Some technical analysts are saying that if BTC slips below that 200-week moving average, we could see several weeks of sideways action around the 300-MA before things pick back up. On the flip side, if Bitcoin can reclaim the $75,000 zone, it might avoid forming another lower high and keep the range intact. Right now it's just compressed volatility and hesitation.
⬤ This kind of ranging isn't unusual for Bitcoin. Historically, these consolidation phases around major moving averages often lead to bigger directional moves once a key support gets tested and holds. What we're seeing is classic indecision - bulls trying to accumulate, bears applying pressure, and nobody winning yet. The market is coiled tight, waiting for a clear breakout signal in either direction.
⬤ Why does this matter beyond just BTC? Because Bitcoin's technical structure sets the tone for the entire crypto market. Where it goes from here - whether down to test longer-term supports or up through resistance - will shape risk appetite across the board and influence how altcoins behave. Tight ranges near major levels like this often come right before volatility spikes when the break finally happens.
 Usman Salis


