Saad Ullah

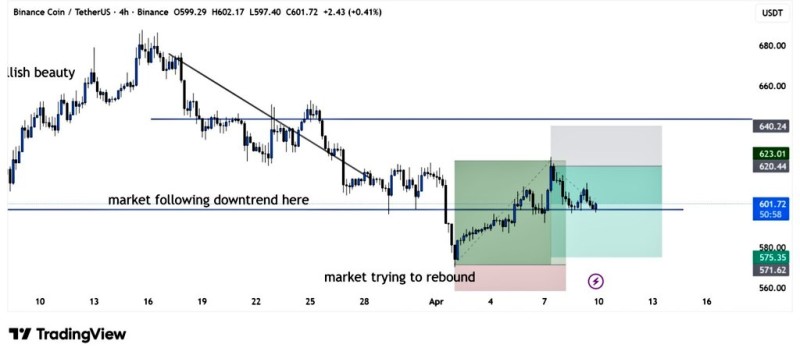
Binance Coin is showing early signs of a recovery attempt, but the picture is far from clear. According to BitGuru, the current move is still just a rebound, with price sitting below key resistance and no confirmed breakout in place. The chart reflects this accurately - price has bounced from recent lows and is now consolidating beneath overhead levels without any decisive move higher.
The Downtrend That Still Defines BNB Structure
The prior trend tells the story. BNB carved out a sequence of lower highs under a descending trendline that capped multiple rally attempts, pushing price lower into a defined support zone. That decline set the context for everything that followed. While the current rebound is visible on the chart, BNB has not yet broken the pattern of lower highs that defines the broader structure.
The current move is still just a rebound, with price sitting below key resistance and no confirmed breakout in place.
This kind of behavior is consistent with BNB rebounds from $570 support seen in recent cycles, where recoveries emerge after sharp declines but require a clear break of structure to shift the trend direction.
Where the BNB Rebound Runs Into Resistance Near $623
The recovery has pushed BNB back toward the $600-$623 range, where price is now stalling. This area is acting as clear resistance in the current structure. Price has tested the upper edge of this zone but failed to sustain any move above it. A higher resistance cluster near $640 remains well out of reach for now.
Price has rebounded, but it has not reclaimed resistance or shifted into a bullish structure. Until that happens, the move remains corrective rather than impulsive.
This is a familiar setup in crypto markets - price reacts upward from support, runs into overhead supply, and stalls before reclaiming meaningful levels. The move is technically incomplete until that changes. For additional context on where overhead supply becomes significant, see the analysis of BNB testing critical $600 support with eyes on $760.
A Range Forming in BNB as Buyers and Sellers Reach Equilibrium
Rather than continuing higher, BNB is forming a compression range beneath resistance. The structure visible on the chart:
- Support established near the rebound zone around $570-$580
- Price consolidating around $600
- Resistance overhead between roughly $623 and $640
This compression reflects a balance between buyers and sellers, with neither side in control. Similar consolidation beneath resistance has played out in broader BNB price action across recent months, where upside remains limited until a breakout confirms that buyers have actually taken over. The pattern is well-documented in the earlier analysis of BNB stalling below $684-$722 resistance.
What the chart shows clearly is a market transitioning from decline into consolidation - but not yet into recovery.
The key detail remains unchanged: there is no confirmed breakout. BNB has rebounded, but it has not reclaimed resistance or shifted into a bullish structure. Until price clears $623 with conviction, the move stays corrective. A market transitioning from decline into consolidation is progress - but it is not the same as a trend reversal, and treating it as one carries real risk.
 Saad Ullah