 Saad Ullah

⬤ BTC has dropped below the key $68,000 level, putting the asset at a sharp technical crossroads. Rising oil prices are stoking inflation concerns — historically a headwind for risk-on assets like crypto. Bitcoin's next few sessions could define whether this correction stabilizes or pushes deeper into lower support territory. Meanwhile, BTC Price Analysis: Bitcoin Eyes $70,000 Drop After Falling from $115,000 Highs outlines how quickly key technical levels can trigger extended corrective moves when support gives way.
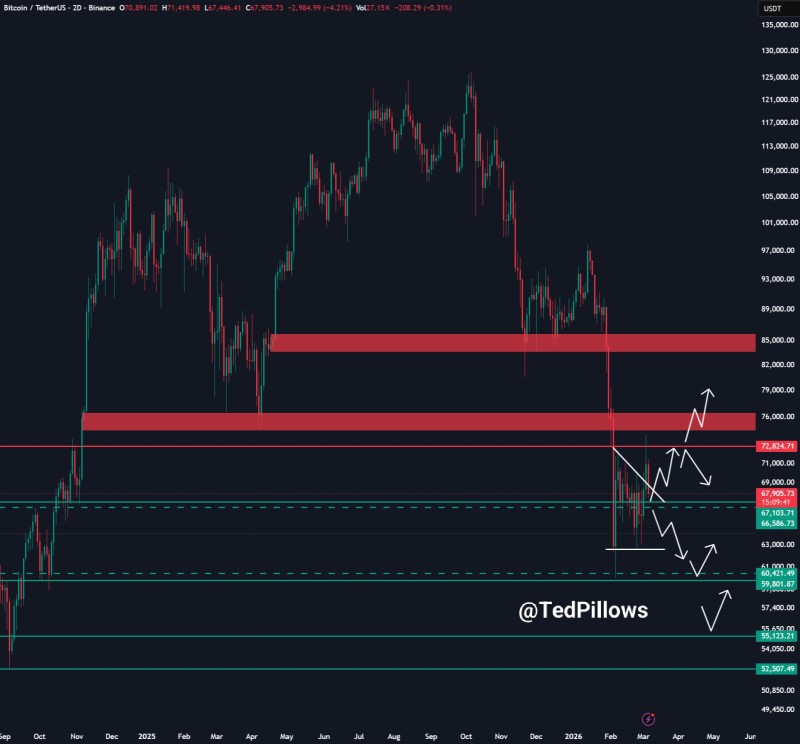
⬤ Price action shows BTC consolidating near $67,000 after losing momentum around $70,000. The chart shows a clear rejection from resistance between $72,000 and $76,000 before the drop picked up speed — a pattern that's played out before at similar structural zones.
Bitcoin must reclaim $70,000 soon — or the $65K–$66K demand zone becomes the next stop.
⬤ Technically, the $70,000 level is the line in the sand. If BTC can't break back above it, the $65,000–$66,000 demand zone becomes the most likely retest target. That scenario is consistent with what was discussed in Bitcoin Faces Fresh Rejection at $70K — $66K Support Under Fire, where analysts identified $66K as the pivot that could decide the next directional leg.
⬤ Beyond technicals, macro forces are doing real damage to sentiment. Higher oil prices reinforce inflation expectations, which tends to pressure speculative assets when liquidity is tightening. Still, the $65K–$70K corridor remains a major structural zone. As explored in Bitcoin Shows Multi-Year Bullish Divergence Near $70K Support, longer-term indicators suggest underlying momentum may still be quietly building beneath the surface noise.
⬤ How BTC responds around the $70,000 mark in the near term will likely define whether the asset holds its current range or extends the pullback toward the deeper support levels visible on the chart. The next move is watching.
 Saad Ullah


