 Eseandre Mordi

⬤ Bitcoin is facing fresh selling pressure, currently trading around $82,600 after pulling back sharply from highs above $115,000. The price has slipped below several key support levels, raising questions about whether the correction still has room to run or if we're nearing a turning point.
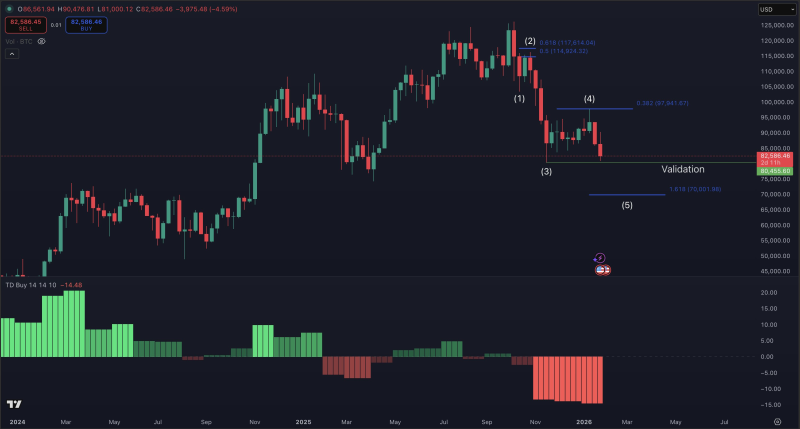
⬤ The chart shows what looks like a five-wave corrective pattern, with Bitcoin possibly moving into the final wave down. The measured target for wave five sits near $70,000—right in line with the 1.618 Fibonacci extension at $70,002. Earlier retracement zones, like the 0.382 Fib level around $97,900, couldn't hold, backing up the bearish read on the structure.
⬤ Momentum isn't helping either. The TD indicator under the price is flashing bright red, showing steady selling pressure and ongoing capital outflows. That persistent negative signal tells us bears are still running the show in the short term, making a quick bounce unlikely. Recent candles have been showing weak bounces and lower highs—classic signs of a market still working through a correction rather than finding its footing.
⬤ The $70,000 area matters because it's a major technical level from the previous rally. If Bitcoin reaches that zone, it'll be a real test of sentiment and could mark an important moment for where the trend goes next. Once this corrective phase wraps up, that level could reshape what traders expect from Bitcoin's next move.
 Eseandre Mordi


