 Saad Ullah

The reclaim signals a shift in short-term structure, with oil transitioning from consolidation into a volatile breakout phase while approaching a historically reactive resistance band.
Oil's $95 Reclaim Changes the Chart Structure
Oil's recent surge has materially changed how the chart looks. After weeks of relatively tight price action in the $55-$65 range, WTI broke higher in March, accelerating through $80.56 and reclaiming $95 - a level that previously acted as resistance.
That reclaim matters technically. Price is now holding above $95, suggesting a support flip and continuation structure built on higher highs and higher lows. RSI near the mid-60s backs this up - showing strength without tipping into extreme overbought territory.
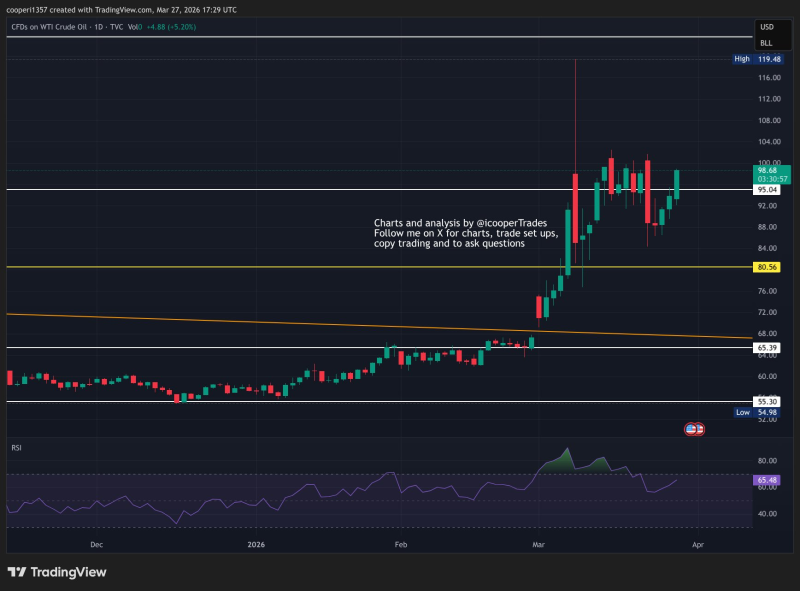
As Ian Cooper noted, the $95-$100 zone has become the key battleground for oil right now.
The $95-$100 Range Now Defines Control
Price action confirms the dynamic playing out between these two levels:
- $95 is acting as a pivot, now being defended after the breakout
- $100 remains a psychological ceiling with repeated rejection
- Consolidation just below resistance suggests a pending expansion move
Recent candles show multiple rejections just under $100, with upper wicks pointing to supply. But dips toward $95 keep attracting buyers, preventing any deeper retracement from taking hold.
The compression between support and resistance reflects a market in equilibrium - typically a precursor to a directional breakout.
WTI Oil Breaks $84: Key Resistance at $87 and $95 Now in Focus tracked the earlier stage of this same move, when $95 was still overhead resistance rather than a floor.
A Rally Fueled by Positioning, Not Just Demand
The speed of the move higher suggests that positioning is playing at least as big a role as fresh demand. Short covering into the weekend appears to be a contributing factor, driving the sharp upward move seen on the chart.
This type of flow can exaggerate price action in the short term - especially when traders reduce exposure ahead of market closures.
Short covering into the weekend appears to be a key driver, and that kind of flow can overshoot quickly before reverting.
The chart also shows a notable spike toward the $119 high followed by a sharp rejection - a reminder of how fast price can run in thin conditions before buyers step back.
Where the Oil Rally Structure Starts to Crack
While the trend remains constructive above $95, early signs of exhaustion are worth watching:
- Multiple failures to hold above $100
- Increasing rejection wicks near resistance
- Momentum flattening after the initial surge
If price keeps stalling below $100, the market risks forming a lower high - a subtle but meaningful shift in structure. WTI Crude Oil Falls 3.5% to $95 as Hormuz Tensions Ease showed how quickly $95 can flip from support to pressure when macro conditions shift.
On the downside, a break back below $95 would weaken the bullish case and open the path toward $80.56 - the last major support level from the breakout phase.
Oil remains technically bullish but tactically fragile - the reaction at $100 will likely determine whether this move extends or becomes a shorting opportunity.
For now, the $100 test is the only thing that matters. How price reacts there will tell traders everything they need to know about whether this rally has legs or is running on borrowed time.
 Saad Ullah


