Usman Salis

A long-term ratio chart comparing the S&P 500 to crude oil is flashing a potential turning point, with price stalling and compressing near trend support. According to Patrick Karim, the structure suggests that upward momentum may already be fading, with confirmation dependent on a breakdown below a key rising level.
SPX/Oil Ratio: A Century-Scale Structure Near Inflection Point
The chart tracks over a century of market behavior, showing the S&P 500 priced in crude oil within repeated long-term cycles. Each cycle reflects extended advances followed by consolidation or reversals.
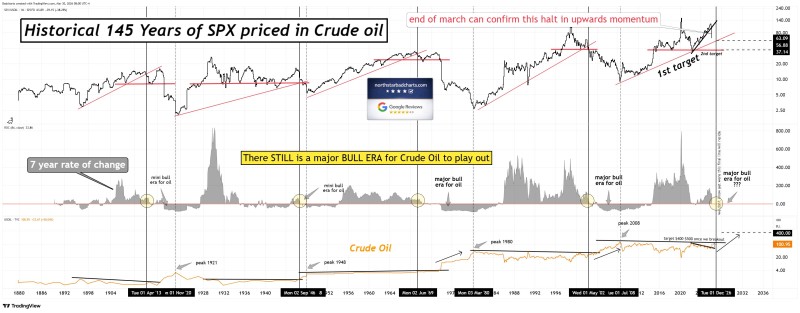
The current structure raises the possibility that a top is already in place, with price losing momentum near resistance while no longer extending higher in a clean trend.
This shift from expansion to hesitation is a key feature of late-cycle behavior.
The Rising Support Line That Now Defines the Trend
The most critical element on the chart is the rising support trendline that has guided the latest advance. Price is now testing this level, making it the defining boundary for the current structure. The setup reflects several warning signs developing in parallel:
- Price compressing near rising support
- Failure to push decisively higher
- Increasing sensitivity to downside breaks
A break below this support would add further evidence that the upward trend has stalled, shifting the broader outlook.
SPX Momentum Shows Signs of Stalling Near Key Levels
The broader structure highlights a transition from sustained upward movement into compression. The chart no longer shows strong continuation but instead reflects hesitation near key levels.
The loss of directional clarity suggests the trend is becoming more fragile - what looked like a steady advance is now showing the kind of hesitation that often precedes a larger shift.
This aligns with broader equity behavior, where the S&P 500 has recently shown signs of weakness near resistance zones while still holding within a broader structure.
Oil's Long-Term Upside Framed by the Ratio
The chart also implies a broader relationship: if the ratio weakens, crude oil may outperform equities over time. The analysis explicitly points to the possibility of significantly higher oil prices in the long term.
If the ratio breaks down, it reflects not just equity weakness, but genuine relative strength building in oil - a signal that energy markets could surprise to the upside.
This aligns with recent energy market dynamics, where crude has shown the ability to move sharply when momentum builds, including rallies toward higher resistance zones and even triple-digit price scenarios. Historical precedent supports this reading, with WTI oil previously surging to $114 amid geopolitical escalation in what became the biggest move since 2022.
The key takeaway remains structural: a ratio breakdown here would carry significant implications for both asset classes going forward.
 Usman Salis