 Marina Lyubimova
Silver is struggling to find footing after a sharp sell-off pushed XAG/USD below the critical $83 support level and into the $80 region. The metal is now caught in a tight consolidation range as bears remain firmly in control, leaving traders watching closely for the next directional move.
XAGUSD Caught in Fibonacci Range Between $80.25 and $80.75
The hourly chart shows price drifting sideways within the 23.6% to 38.2% Fibonacci retracement zone, roughly between $80.25 and $80.75. A descending trend line overhead, combined with nearby moving averages, continues to cap any recovery attempts.
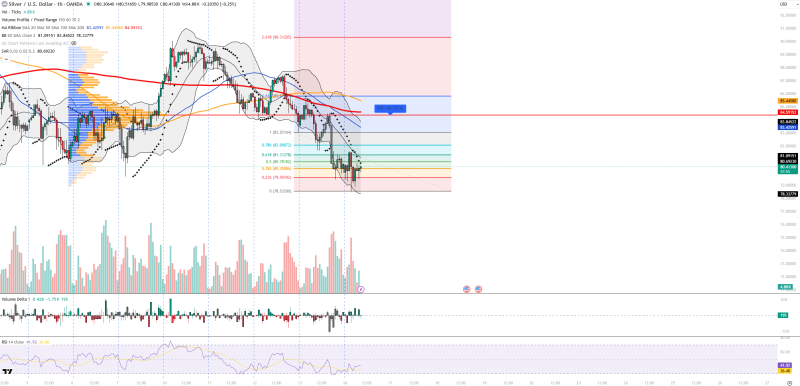
The chart is printing a clear sequence of lower highs and lower lows, confirming that short-term momentum stays bearish. As noted by Silver Falls Toward $81 Support as Bearish Pressure Grows, similar selling dynamics have been playing out across recent sessions.
Point of Control at $84.35 Signals Strong Overhead Supply
Volume Profile analysis places the Point of Control near $84.35, marking the zone where the heaviest historical trading activity occurred. This level now represents a significant resistance ceiling. The RSI is showing weak momentum, the Parabolic SAR continues to point downward, and Bollinger Bands show price pressing against the lower band. Together, these signals support a cautious near-term outlook for XAG/USD.
Key supports sit at $80.25, $79.60, $78.53, and $77.90. On the upside, resistance levels are stacked at $80.95, $81.32, $83.42, and $84.59. Beyond the charts, silver remains sensitive to U.S. dollar strength, interest rate expectations, and shifting industrial demand. As covered in Silver Struggles Below $85 After Sharp Drop From $96.5, the $80 to $85 corridor has repeatedly acted as the decisive battleground for silver prices. Meanwhile, Silver Targets $91 if $85 Support Holds After Rebound From $78 outlines what a recovery scenario could look like if buyers manage to reclaim key ground. Until a decisive breakout occurs, silver looks set to remain under pressure.
 Marina Lyubimova


