 Sergey Diakov

Silver is sliding back toward a critical support zone after buyers failed to hold their ground, and the structure is starting to look shaky. The hourly chart tells a pretty clear story - sellers are back in control, and the next few sessions could be decisive.
The setup was flagged early, noting that selling pressure returned precisely from the 71.3 resistance region - and the chart confirms exactly that.
The Bounce From 65.0 That Hit a Wall at 71.3
After dropping hard from 73.8 all the way to 65.0, silver managed to bounce back toward 71.3. But that's where the recovery ran out of steam.
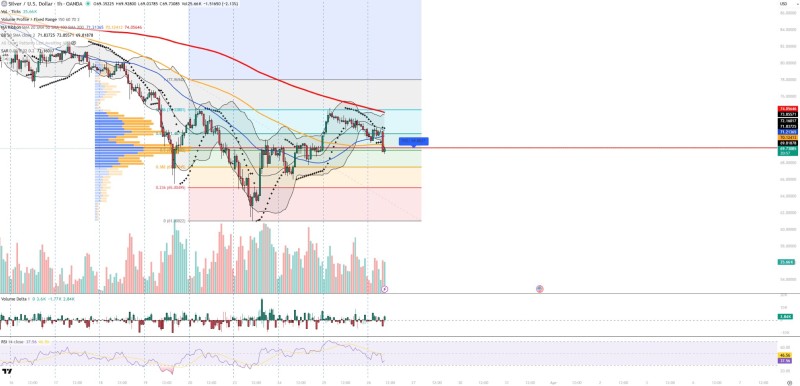
The rejection from that level was clean and convincing, cementing it as strong resistance and reinforcing the broader bearish trend.
Selling pressure returned precisely from this region.
The follow-through was textbook - a sequence of lower highs formed after the bounce, which is exactly what you see when buyers try and fail to regain control. To make things worse, price is still sitting below key moving averages, including a downward-sloping higher timeframe average that keeps capping any upside attempt.
Silver's 69.7 Support Cluster Is Cracking
Right now, silver is testing the 69.7 area, which lines up closely with the volume profile point of control near 69.8. In theory, this should be a solid floor. In practice, the signals suggest it's already under strain.
The technical picture matches what Forex Sinyal Merkezi described in the original analysis:
- RSI below 40, confirming weak momentum
- Price pressing near the lower Bollinger Band
- Parabolic SAR sitting in bearish alignment above price
- Negative volume delta with visible selling pressure
The chart visually confirms a slight breakdown attempt below this area.
The analysis notes - meaning support isn't firmly holding, it's already being tested. A decisive close below 69.0 would likely open the door to 67.8, with the prior swing low at 65.0 as the deeper downside target. This kind of structure - support compression followed by breakdown - is a pattern commodities traders know well, and it often precedes acceleration phases. For more context on silver's recent price dynamics, check out Silver Price: XAG/USD at Critical Juncture.
The One Level That Could Flip the Script
Despite all the bearish signals, the setup isn't entirely broken yet. The level to watch is 71.3. A clean move back above that zone would invalidate the immediate bearish sequence and reopen the path toward the 73.0-74.0 range. But it would need real follow-through - overhead resistance up there is still thick.
Similar setups in silver often show repeated failures at resistance before either a breakdown or a stronger breakout attempt emerges.
That patience is warranted here. XAG/USD: Silver Tests $50.23 Resistance offers a useful parallel for understanding how these decision zones tend to play out.
Controlled Distribution, Not Panic - But Still Tilting Lower
What's interesting about the current setup is that this doesn't look like panic selling. Volume is rising on down moves, but price is still holding within a defined range. That's more consistent with controlled distribution than full-on liquidation. This type of consolidation near support often precedes a directional move - and in several recent XAG/USD setups, similar compression phases near key levels acted as the calm before expansion. For another recent example of this dynamic, Silver Price Analysis: Consolidation Forms Near 88-89 Resistance walks through a comparable structure.
For now, silver is leaning bearish. Sellers have the upper hand below resistance, and unless buyers can reclaim higher ground, the path of least resistance points lower.
 Sergey Diakov


