 Victoria Bazir

Following a sharp rally and an equally aggressive correction, XAG/USD is now stabilizing near the mid-$70 region. The chart outlines a projected path where consolidation transitions into expansion, with progressively higher targets if key resistance zones are reclaimed. According to analyst Rashad Hajiyev, this recovery could evolve into a broader advancing leg within the current market cycle.
The Silver Sell-Off That Reset the Trend
The chart shows silver climbing steadily from below $50 into a peak above $110, establishing a strong bullish leg. That advance ended with a sharp rejection at the highs, followed by a vertical sell-off that erased a large portion of the gains.
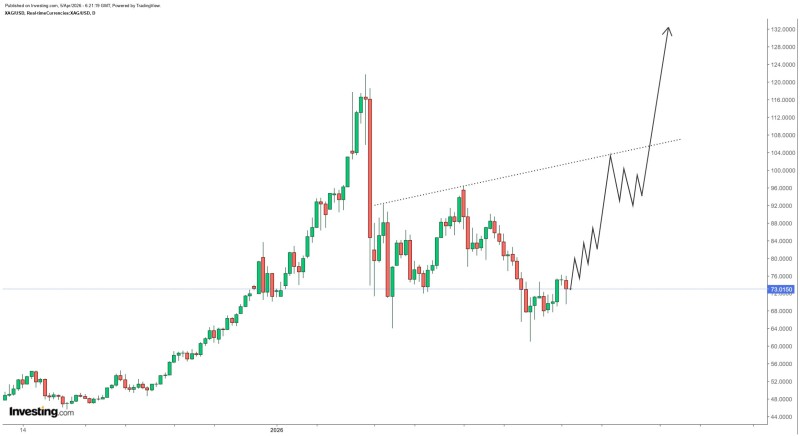
This breakdown disrupted the prior trend, shifting the structure from expansion into a corrective phase. The decline found footing near the low-$70 area, where price began to stabilize.
Price is building a base that looks more like a launch pad than a floor - the structure has the fingerprints of a cycle that isn't finished yet.
Since then, candles reflect choppy, overlapping movement rather than directional momentum - typical of a market transitioning into consolidation.
A Recovery Structure Begins to Form in XAG/USD
Price is now attempting to rebuild from the 70-75 region, forming a base after the sell-off. The structure suggests a gradual recovery rather than an immediate breakout, with higher lows beginning to emerge on the right side of the chart.
The projected path shows a step-like advance, indicating that upside may develop in phases rather than a single impulsive move. Compression phases of this kind often precede breakout moves, particularly when the structure holds above a well-defined base.
The First Silver Test Lies Above $100
The chart outlines an initial move toward the $104-$106 zone, which represents the first major upside objective. This area aligns with a psychological barrier and sits below the previous peak, making it a natural test of strength. A move into this region would confirm that buyers have regained control after the correction phase.
Recent market behavior supports this type of setup, where consolidation near the mid-$70 range precedes expansion attempts toward higher levels. The pattern echoes previous cycles where silver held a trendline near $72 before mounting a sustained advance.
Key structural conditions that support a recovery move include:
- Higher lows forming on the right side of the consolidation range
- Choppy, overlapping candles indicating absorption rather than distribution
- Price holding above the low-$70 support zone after the corrective sell-off
- Initial resistance at the $104-$106 zone serving as the first meaningful breakout test
From Breakout to Acceleration Toward $140-$150
Beyond the initial recovery, the projected structure suggests a shallow pullback followed by a breakout toward the $140-$150 range. This step reflects continuation behavior, where price maintains higher lows while pushing into new territory. Such progression is consistent with broader technical cycles, where consolidation phases resolve into strong impulsive legs.
The shallow pullbacks within a rising structure are often where the next leg charges up - the price doesn't need a deep reset when the underlying trend is intact.
The final phase outlined on the chart shows a parabolic expansion, with price accelerating sharply after clearing major resistance zones. This type of move reflects momentum-driven conditions, where prior resistance levels are no longer restrictive and trend continuation becomes self-reinforcing. A similar dynamic - where stabilization phases preceded strong upside continuation - has been documented in silver's 6% jump as momentum built toward $100.
Silver remains in a rebuilding phase for now, but the structure suggests that once momentum returns, the next move may unfold in stages - with each breakout reinforcing the broader trend and pushing the metal toward multi-year highs.
 Victoria Bazir


