 Usman Salis

⬤Silver showed strong intraday demand after reversing sharply from session lows. Buyers stepped in midway through the trading session and pushed price higher, printing a hammer candlestick on the daily chart. This pattern typically reflects buying interest after early selling pressure and tends to appear near technical support zones where traders begin defending price structure. Silver Prints Doji Near 50 EMA as Bearish Pennant Takes Shape for broader context on recent candle behavior around this moving average.
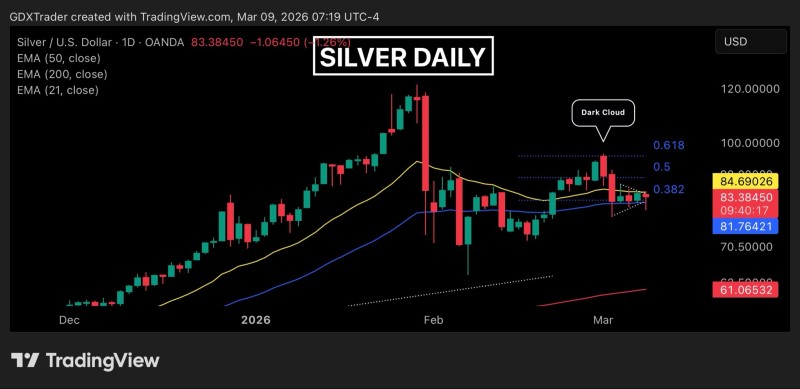
⬤The rebound pushed Silver back above the 50-day exponential moving average, a key indicator used to gauge short-term trend momentum. Price also moved back inside a developing pennant pattern, suggesting buyers are actively defending the structure and preventing a breakdown below the consolidation range. This type of price behavior often precedes the next directional move.
⬤The daily chart highlights several Fibonacci retracement levels, including the 0.382, 0.5, and 0.618 zones, which commonly act as reaction areas during corrections within broader trends. Silver's earlier rally pushed prices significantly higher before entering the current consolidation phase, where alternating bullish and bearish candles reflect a market searching for direction. See how Silver Struggles Near $77.90 Support as Bears Keep Control and how similar support tests have played out in previous setups.
⬤Despite the intraday recovery, Silver continues trading within a broader consolidation structure, keeping the overall market tone neutral. Without a confirmed breakout from the pennant, price action remains confined between technical support and resistance. The reaction around the 50 EMA and nearby Fibonacci levels will likely determine whether Silver resumes its upward momentum or continues moving sideways. Silver Consolidates in 86-89 Range as It Eyes the 90.60 Resistance for a look at how the metal has behaved during previous consolidation phases.
 Usman Salis


