 Saad Ullah
Silver (XAG/USD) is showing clear signs of hesitation on the daily chart. Price action has tightened around key technical levels, and the latest session closed as a doji candle, a pattern widely associated with indecision between buyers and sellers. The metal is currently hovering just above its 50-day exponential moving average, a level traders treat as a short-term trend gauge.
That same chart structure has attracted attention for another reason: the compression in price following a sharp pullback from highs above $110 bears the hallmarks of a bearish pennant. When this kind of formation appears after a downward move, technicians often treat it as a potential continuation signal rather than a recovery setup.
Fibonacci Resistance and Momentum Signals Raise Caution Flags
Fibonacci retracement levels add further texture to the picture. Resistance zones near 0.382, 0.5, and 0.618 are all sitting above current price, creating a layered ceiling that bulls would need to clear to shift the narrative. These levels have historically attracted selling interest during consolidation phases, and the current setup appears consistent with that pattern. For context, previous breakouts like the one covered in Silver Price Breaks Higher With a 7.7% Rally Above Key Resistance showed that tight compression can precede sharp moves in either direction.
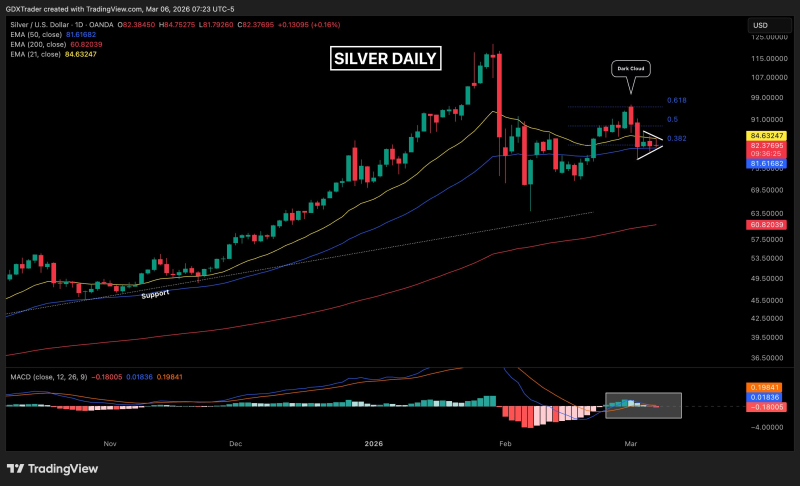
Momentum indicators lean bearish for now. The MACD has crossed below its signal line, suggesting near-term selling pressure is building. That said, price continues to hold above the 200-day EMA near $60, which keeps the longer-term trend structure from flipping outright negative. As explored in Silver Price Jumps 6% and Eyes $100 as Momentum Builds, prior technical stabilization near key moving averages did eventually give way to renewed upside, though the entry conditions then were considerably more constructive than what's visible now.
Key Levels to Watch as XAG/USD Awaits a Decisive Break
Silver remains pinned between nearby resistance and support, and neither side has shown the conviction needed for a clean breakout. Historical chart studies in Silver Price Prediction: Breakout Could Target $63 have emphasized that technical formations near critical zones frequently define the next major move. Right now, traders are watching closely for a decisive break in either direction. Until the price clears resistance or confirms a breakdown below the 50 EMA, the mixed signals suggest staying patient rather than forcing a position.
 Saad Ullah


