Eseandre Mordi

Silver is continuing its recovery from the March low, with price action now pushing higher toward a key Fibonacci retracement zone. The move suggests short-term strength - but the structure still reflects a developing bear market, making the current advance corrective rather than a confirmed reversal.
The Silver Bounce Targeting a Key Fibonacci Zone
Following a sharp decline from the March high near $96 down to approximately $61, silver has staged a steady rebound. The price has already reclaimed the 0.618 retracement level around $82.88 and is now moving toward the 0.786 Fibonacci level near $88.84.
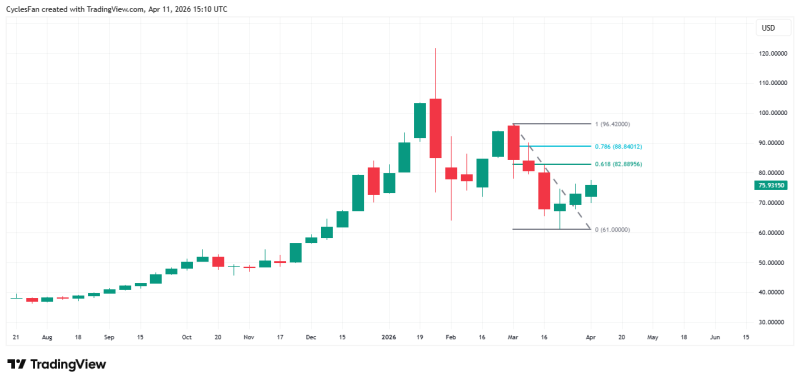
As CyclesFan noted, this recovery could extend into late April, with the 78.6% retracement acting as the next upside target. Silver tests resistance near $90 after rebound shows how the $88-$90 zone has repeatedly acted as a key decision point in silver's recent price action - reinforcing why the current approach to that level carries more weight than a routine technical resistance.
A Corrective Silver Move Inside a Larger Bearish Structure
Despite the rebound, the chart structure continues to show characteristics of a developing downtrend. The drop from the March peak established a strong impulsive leg lower, and the current move appears to be a retracement within that decline rather than a new bullish phase.
Price is still operating below the prior high, and the broader pattern reflects a lower high structure forming after the selloff. This keeps the overall bias tilted to the downside unless silver can reclaim the upper range near $96.
Silver rebounds from key support with bullish momentum captured the initial recovery phase as it was developing, showing the support dynamics that launched the current rebound - and why the move from $61 has been more sustained than a typical dead-cat bounce.
Where the Silver Move Could Stall at $88
The area around $88.84 is now the critical test. This level represents a deep retracement of the prior decline and often acts as a ceiling in corrective rallies. Silver retreats after hitting $88-$90 resistance zone documented a prior rejection from this exact zone, showing how sellers have historically stepped in once price approaches these levels.
If rejection occurs again at this level, it would reinforce the idea that the current rally is a bounce within a broader bearish cycle rather than the start of a new trend. The strength of the move from $61 increases the likelihood of a full test of this resistance before any decisive reversal - but the test itself will determine whether the correction is over or just pausing.
 Eseandre Mordi