Peter Smith

A decisive shift in silver's technical structure is unfolding as price action weakens following a breakdown from its prior uptrend. GDXTrader noted that silver has moved into a corrective phase, forming lower highs and lower lows while struggling beneath key moving averages - an early signal that sellers remain in control.
After peaking near the $110-$120 region, silver reversed sharply and entered a sequence of lower highs and lower lows, confirming a loss of bullish momentum. Price has since broken below both the 50-day and 100-day exponential moving averages, which now act as dynamic resistance.
Silver has moved into a corrective phase, forming lower highs and lower lows while struggling beneath key moving averages.
Silver Breakdown Signals Structural Shift After $110-$120 Peak
The chart clearly shows silver transitioning from a strong uptrend into a bearish structure after that peak. Following the reversal, the market stabilized in the mid-$60 range, but a recent attempt to reclaim overhead resistance near the 100 EMA failed, producing a rejection pattern that reinforced the bearish setup.
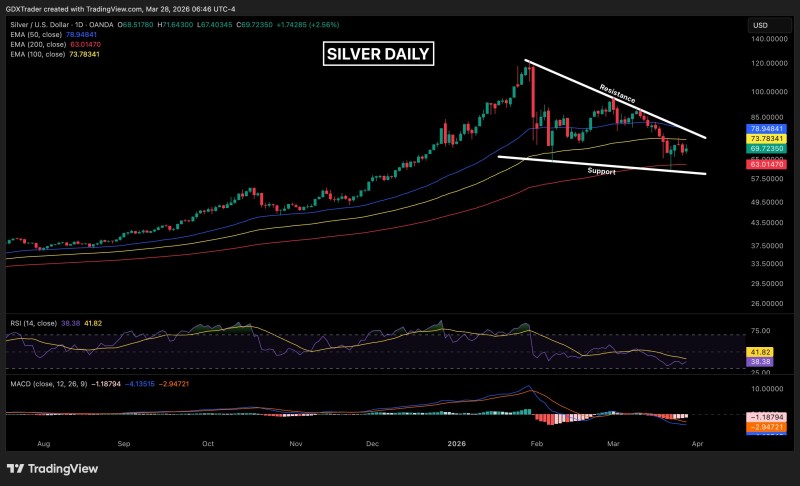
This aligns with broader market behavior where silver has been testing the $70 trendline after a sharp drawdown from highs - a level that carries significant technical weight going forward.
The rejection near the 100 EMA confirmed sellers are still in control, with no convincing recovery attempt in sight.
Silver Wedge Pattern Compresses Near 200-Day MA in Low $60s
Silver is now compressing within a falling wedge formation, with descending resistance capping rallies and support forming near the 200-day moving average around the low $60s. This level has held so far, preventing a deeper breakdown.
However, the price action within the wedge appears corrective rather than impulsive, lacking strong bullish follow-through. Recent sessions show consolidation rather than recovery, with price struggling to build momentum after each bounce. This behavior reflects a market that is stabilizing - but not yet reversing.
Silver Momentum Indicators Stay Bearish With RSI Near 38
Technical indicators remain aligned with the bearish outlook:
- RSI is hovering around 38, indicating weak demand
- MACD remains below the signal line with no bullish crossover
- Price continues to trade below short- and mid-term moving averages
These signals reinforce the idea that the market is still under pressure, with no confirmed shift in momentum. Similar dynamics have played out recently, with silver struggling to hold key levels and showing signs of weakening structure after failed recovery attempts.
The interaction with the 200-day moving average is now critical. While this level continues to act as support, repeated tests without a strong rebound increase the risk of a breakdown. Descending resistance continues to cap upside attempts, maintaining the pattern of lower highs.
Until price can reclaim higher levels and break the sequence of lower highs, the structure remains tilted to the downside.
This mirrors broader technical setups where silver compresses under resistance while testing support zones - a pattern that often precedes decisive directional moves. Until price can reclaim higher levels and break the sequence of lower highs, sellers maintain control over the short-term trend.
 Peter Smith