 Eseandre Mordi

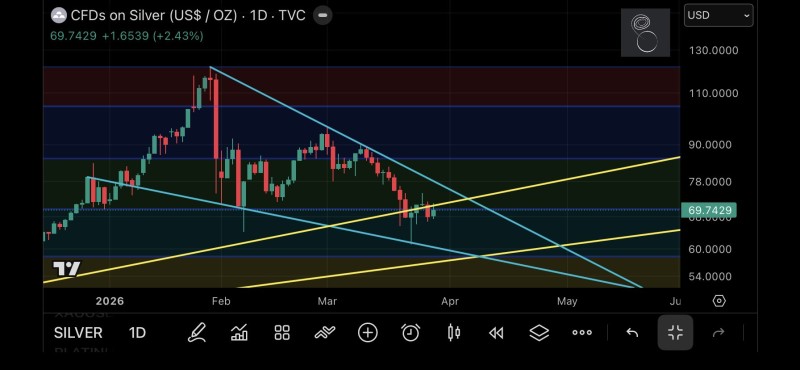
As Dr. Potassium pointed out, reclaiming the August 2025 trendline could trigger a renewed bullish phase with projections extending toward $100 and beyond. The chart supports this view - but only if price can escape its current compression. Silver has returned to a decisive technical zone where structure, momentum, and positioning all converge at once.
The $110 Breakdown That Shifted Silver's Trend
The chart tells a clear story. After peaking near $110-$115 in February, silver faced a sharp rejection and broke down from its uptrend. That move handed control to sellers and established the corrective structure that still defines price action today.
Since then, the metal has followed a familiar corrective script:
- Lost bullish momentum after failing to hold above $90
- Formed a descending resistance trendline that has capped every rally attempt
- Stabilized in the $65-$70 zone following a steep drawdown
This pattern aligns with broader technical behavior seen across recent silver market analysis, where descending trendlines typically frame corrective phases before a potential expansion move. The current structure is not impulsive - it is corrective. Price is no longer making higher highs, and until that changes, silver remains in a transitional phase rather than a confirmed uptrend.
Reclaiming the August 2025 trendline could trigger a renewed bullish phase, with projections extending toward triple-digit territory later this year.
Silver Compresses at a Critical $69-$72 Pivot Zone
Silver is now trading directly at the intersection of two competing forces: descending resistance from the February high and a rising long-term support trendline from below. That creates a compression setup.
The range is tightening, volatility is compressing, and price is pressing directly into resistance. Markets rarely stay in this state for long.
The $69-$72 range is acting as a structural pivot. Multiple reactions around this level confirm that demand is present - but upside attempts keep stalling beneath the descending resistance. This kind of tightening price action has historically preceded sharp directional moves, particularly once price manages to reclaim key structural levels. Similar setups in silver futures have led to rapid expansion once resistance gave way.
Key Silver Resistance Levels: $85, $96, and $111
If silver breaks above the descending trendline, the chart identifies three zones where momentum could meet friction:
- $85 - prior consolidation and overhead supply
- $96 - former distribution range and rejection area
- $111 - the major high that originally triggered the breakdown
These are not arbitrary numbers. Each level marks a zone where sellers previously took control, and each could introduce volatility during any recovery. That said, the structure becomes significantly cleaner above $111. This is what supports longer-term projections toward $150 if bullish momentum fully re-establishes - a scenario explored in depth in the Silver Targets $150 Wave 5 analysis.
The Silver Breakout Signal That Changes Everything
The trigger that matters most remains straightforward: a confirmed reclaim of the long-term descending trendline.
A sustained breakout above this level would:
- Break the sequence of lower highs that has defined the correction
- Restore bullish structure to the chart
- Shift control decisively back to buyers
A breakout would not just be another move higher - it would mark a structural shift with the potential to reintroduce triple-digit price discussions into the narrative.
Until that happens, silver stays in a neutral-to-corrective phase despite holding support. What makes this moment particularly notable is timing - the compression is advanced, the range is narrow, and price is pressing directly into resistance. A breakout here would not just be another leg higher. It would mark a genuine structural shift, one capable of putting $100+ back into the conversation.
 Eseandre Mordi


