 Peter Smith

Oil market expectations are shifting as new projections highlight how disruptions to OPEC+ supply could reshape balances into 2026. As Tracy Shuchart noted, major agencies are working with different assumptions around the timing and scale of supply losses - but all scenarios reflect constrained flows and a gradual recovery path.
Three Models, One Fragile OPEC+ Supply Path
The chart compares estimates from the IEA, US EIA, and BNEF across multiple forecast updates, showing how expectations evolve from late 2025 into 2026. Each dataset reflects a similar structure: balances increase into early 2026 before being revised lower in the most recent projection.
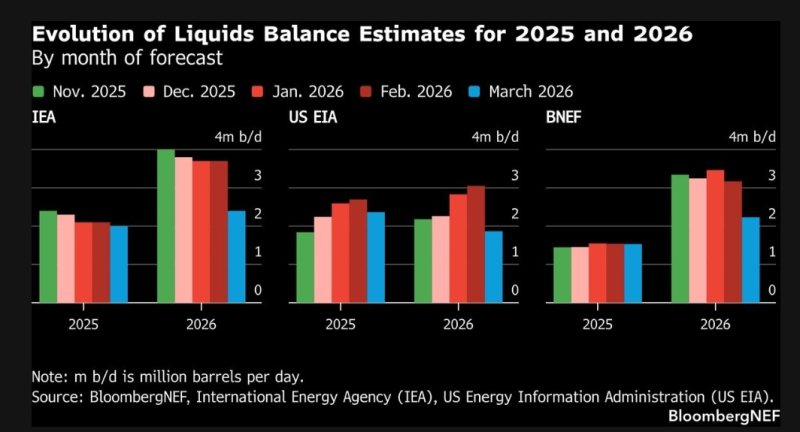
The IEA assumes minimal flows through the Strait of Hormuz in March, followed by a partial recovery from April to June as bypass routes and mitigation measures are deployed. The US EIA models a peak in shut-in Middle East production in early April - led by Iraq, with smaller disruptions in Kuwait, the UAE, and Saudi Arabia - before easing as transit resumes. BNEF presents the most disruption-heavy scenario, assuming a mid-April reopening and upstream supply losses reaching 8.8 million barrels per day during March and April.
The Revision That Reshapes 2026 Oil Balance Expectations
Across all three agencies, the most recent projection shows a consistent downward adjustment compared to earlier forecasts. Previous estimates pointed to balances near or above 3 million barrels per day in 2026, while the latest figures shift closer to roughly 2 million barrels per day.
This synchronized revision reflects a change in assumptions around the duration and severity of disruptions. Recovery is no longer modeled as immediate - it unfolds gradually, flattening the balance trajectory across all three datasets.
WTI Oil Spike to $120 Raises US Recession Risk Above 50% shows how sensitive price behavior has already become to this kind of supply shock scenario - and why the direction of these balance revisions matters well beyond the oil market itself.
Where the Oil Supply Cushion Starts to Shrink
The chart highlights a transition between late 2025 and early 2026, where projected surpluses peak and begin to decline. While balances remain positive across all models, the reduction in surplus narrows the margin of safety in the system:
- IEA balances move from above 3 million b/d down toward ~2 million b/d
- US EIA projections ease back toward the 1.5-2 million b/d range
- BNEF estimates drop from above 3 million b/d closer to ~2 million b/d
This convergence suggests a market becoming more sensitive to ongoing disruptions, with less buffer available if supply recovery is delayed further.
Brent Crude Holds Near $72 as Oil Benchmarks Approach Multi-Month Highs in February 2026 captures how Brent pricing has already begun reflecting this tightening expectation, with benchmarks pushing toward multi-month highs ahead of the disruption scenarios now being modeled.
The defining feature of the outlook is the reliance on reopening timelines and mitigation efforts. That shift does not signal an immediate deficit - but it does indicate a more constrained system heading into 2026. As projections continue to adjust, the oil market is increasingly shaped by how quickly disrupted flows can return, and how much resilience remains if they do not.
 Peter Smith


