Usman Salis

U.S. natural gas is diverging sharply from global trends. Futures have slipped to their lowest level in over a year, with supply continuing to outpace demand at a pace that is starting to look structural. Ole S Hansen flagged the latest EIA data showing a 50 bcf storage build that pushed total inventories to 1,911 bcf - now running 4.8% above the five-year average and signaling a growing imbalance that is actively weighing on prices.
Natural Gas Storage Surplus Becomes the Dominant Signal
The storage picture tells a clear story. After dipping earlier in the year, inventories have rebounded steadily and now sit above the five-year historical range.
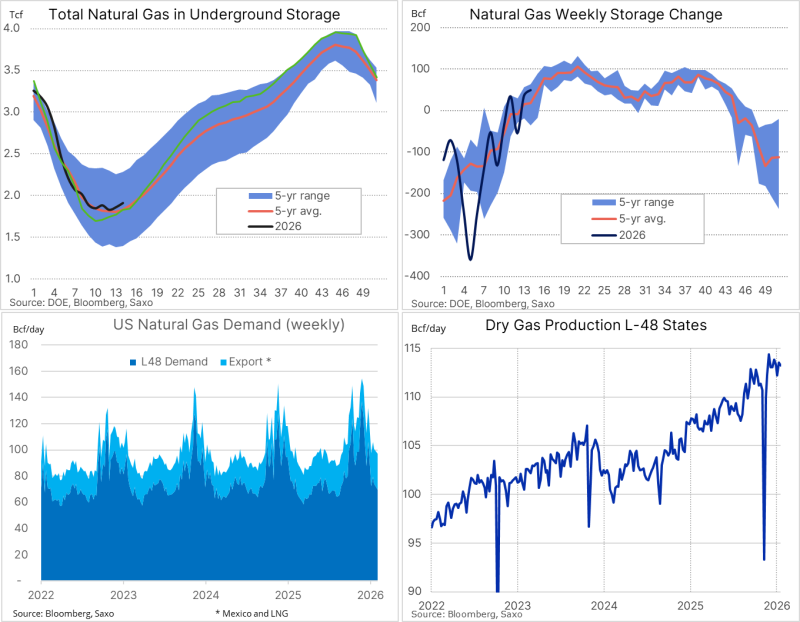
The latest +50 bcf injection confirms this is not simply a seasonal effect - supply is accumulating faster than typical benchmarks, and that dynamic tends to suppress any sustained price recovery.
Traders watching the storage chart will recognize the pattern: once inventory levels break above historical norms, the ceiling on price rallies tightens considerably. The data is providing exactly that signal right now. For broader context on how this fits with recent price moves, Natural Gas Tests $3 Support After 8% Drop traces the technical deterioration that preceded the current storage build.
Natural Gas Production Strength Reinforces the Downtrend
Dry gas production across the Lower 48 continues to trend higher, moving steadily toward record output levels.
Even brief, temporary dips in production have done nothing to alter the broader trajectory - each time output pulled back slightly, it quickly resumed climbing. The pattern makes one thing clear: supply pressure here is not event-driven or seasonal. It is built into the current structure of the market.
U.S. Natural Gas Price Structure Shows Persistent Weakness
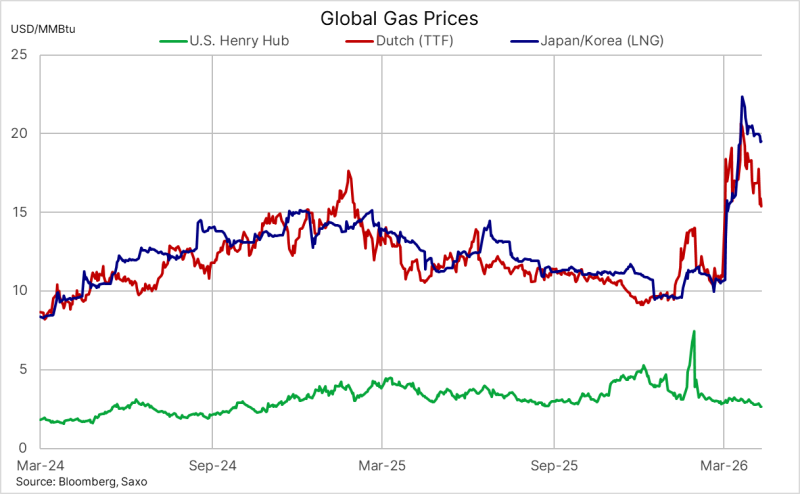
The contrast with global benchmarks is hard to ignore. Dutch TTF and Asian LNG prices have surged sharply while U.S. Henry Hub remains subdued and recently pushed even lower. Domestically, the technical structure reinforces the bearish read:
- Repeated failures to sustain any meaningful rally
- A pattern of lower highs forming over time
- Inability to hold above the key psychological level near $3/MMBtu
This divergence makes one thing apparent: U.S. price action is being driven by domestic fundamentals, not global shocks. International supply disruptions or demand spikes simply are not feeding through to Henry Hub in any sustained way. The detailed breakdown of the bearish pattern that preceded the current leg lower is worth reviewing - Natural Gas Slides to $3.388 After Bearish Kicker Pattern covers the technical formation that set this move in motion.
Demand Struggles to Keep Pace With Rising Supply
Demand trends do show periodic spikes, but none have been sustained long enough to absorb what production is adding to the system. Every rally attempt runs into selling pressure relatively quickly, because the underlying imbalance between supply and consumption has not resolved - it has widened.
The imbalance between production and consumption continues to widen, keeping the market anchored despite volatility elsewhere in global gas markets.
The current setup leaves U.S. natural gas locked in a structurally weak position. Rising inventories and steady production are more than enough to offset short-term demand fluctuations - and until that balance shifts meaningfully, the path of least resistance remains to the downside.
 Usman Salis