Marina Lyubimova

Gold is compressing into a critical structure, with price holding above a defined buy zone while approaching nearby resistance. As Mary Taylor noted, the setup remains constructive - with upside scenarios developing toward the weekly high near 4,858 and higher if momentum continues.
The Gold Structure That Shifted From Decline to Compression
The chart shows a clear transition from a prior downtrend into a recovery phase. After printing lower highs from the 5,300+ region, gold established a bottom and began forming higher lows. That shift is now visible in a tightening structure, where rising support meets descending resistance.
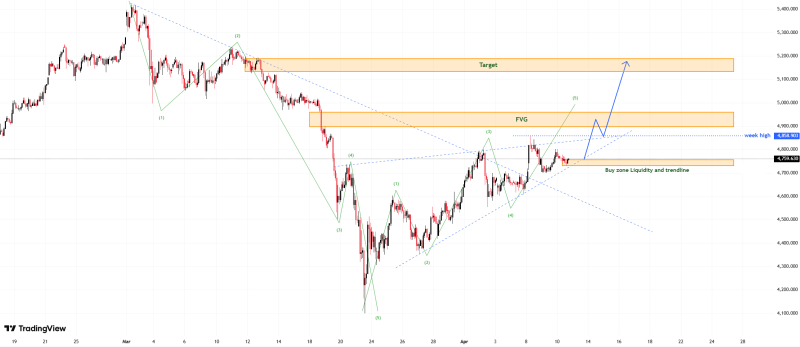
This type of compression often signals a market preparing for expansion rather than continuation of the previous bearish leg - the structure has moved from trending lower to coiling, and the distinction matters for what comes next.
Why the XAU/USD 4,750-4,800 Area Is Defining the Setup
Price is currently stabilizing around the 4,750 region, which aligns with the marked buy zone liquidity and trendline on the chart. This area has acted as support during recent pullbacks, keeping the sequence of higher lows intact.
At the same time, the market is approaching a horizontal level near 4,858, identified as the weekly high. This creates a clear and readable structure:
- Support holds in the 4,700-4,750 region
- Resistance sits just below 4,858
- Price is compressing between these zones
Gold Price Analysis: Critical $4,280 Support Level in Focus shows what the support structure looked like at a lower level, providing context for how gold has been building a ladder of higher lows as the compression toward 4,858 has developed.
The Path That Opens Above the Gold Weekly High
A move above the 4,858 level would mark a structural shift. According to the chart, that breakout opens the path toward the 4,900-4,950 zone - identified as a fair value gap. Beyond that, the projection extends toward the 5,100-5,150 region if momentum continues to build.
Gold at Pivotal H4 Trend Line: $4,600 and $5,600 in Focus maps the broader range that the current compression sits within, showing how the 5,100-5,150 projection aligns with the upper end of the longer-term technical framework. Gold Price Prediction: Triangle Pattern Near $3,300 Signals Potential $8K Breakout adds the macro cycle context, placing the current consolidation within a much larger pattern where compression phases have historically preceded aggressive expansion moves.
What stands out is the consistency of higher lows against a relatively flat resistance ceiling. That structure keeps pressure building beneath the weekly high - and the next move will be defined by whether price can reclaim 4,858 and transition from compression into continuation.
 Marina Lyubimova