Eseandre Mordi

⬤ Gold is trading back above the $5,091 mark on the weekly chart, and the uptrend is looking as healthy as ever. After gold held its ascending channel through a 3-month bullish climb, the price structure shows very little real risk of a meaningful breakdown. Multiple rising trend lines have been respected all through 2025, and the chart keeps printing higher lows and higher highs without any serious challenge to that rhythm.
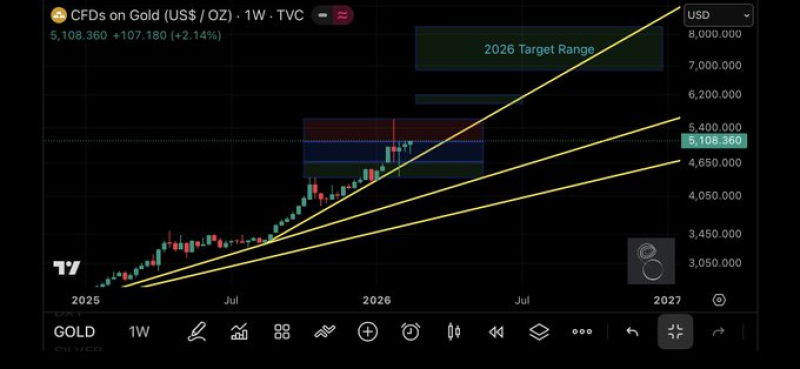
⬤ The weekly chart shows gold moving inside a channel of ascending support lines, with immediate trend support sitting roughly in the $4,650-$5,100 range depending on which line gets tested. Even if prices pulled back to retest a major trend line, the expected floor would still be near $5,100 by year-end - which is hardly a bearish scenario. When gold was testing $5,043 resistance with an all-time high scenario emerging, the broader 2026 price targets already visible on the chart sat well above current levels.
⬤ The macro picture adds another layer of conviction here. Central banks in emerging markets have been rotating out of U.S. Treasuries and into gold at a pace that simply wasn't happening during the 2008 financial crisis. That structural demand means any dip toward trend line support is more likely to attract fresh buyers than signal a reversal. Back when the $4,280 support level was the critical line in focus, official sector buying was already being flagged as a key reason dips kept getting absorbed.
⬤ Staying above $5,000 matters beyond just the near-term chart setup. It reflects a convergence of technical strength and sustained institutional demand that is likely to shape sentiment across the precious metals space well into 2026. With trend lines intact and upside targets sitting meaningfully above current prices, the path of least resistance still points higher.
 Eseandre Mordi