 Usman Salis

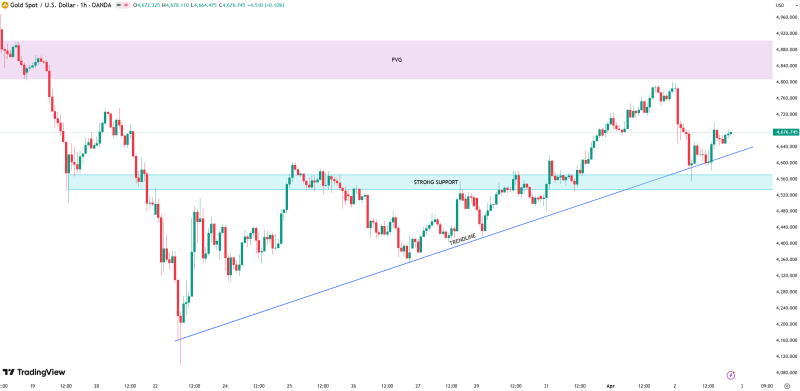
Gold is trading just above a key demand zone after a pullback, placing the market at a pivotal moment. According to analyst Allie, the $4,594 level is central to maintaining bullish control, with the broader structure depending on whether this area continues to hold.
The chart shows XAUUSD holding support while maintaining an upward structure, keeping higher targets in play if the level remains intact. An ascending trendline beneath price reinforces this picture, showing the market is still forming higher lows rather than breaking down.
The $4,594 level is the key to maintaining bullish control - as long as price holds here, higher targets remain in play.
The Gold Level That Keeps Buyers in Control
The chart clearly marks a demand zone around $4,594, labeled as strong support. Price has pulled back into this area and is now holding above it, suggesting buyers remain active at this level. Gold builds base near $4,625 support after sell-off, showing this type of stabilization is consistent with recent market behavior.
This behavior aligns with broader gold technical analysis, where holding key support zones tends to preserve the underlying trend structure. Similar setups show gold stabilizing near support after declines before attempting continuation higher.
A Structure That Remains Intact
Price action reflects a controlled pullback rather than a breakdown. The chart shows gold reacting off the support zone and moving back toward higher levels, maintaining the broader upward trajectory. Price analysis: gold faces $4,600 resistance after $4,660 high - that zone has repeatedly acted as a reference point for the current structure.
Price is pulling back in a controlled way, not breaking down. The structure of higher lows is still very much intact.
Where price both respects horizontal support and follows a rising trendline, conditions typically point to continuation rather than reversal. Gold has shown this behavior repeatedly, where consolidation above support precedes the next leg higher.
Gold Path Toward $5,000: Key Upside Levels
The chart outlines a sequence of upside levels that come into focus if support holds:
- $4,670 as the immediate resistance above current price
- $4,854 as the next major resistance zone
- $5,000 as the broader upside target
This step-like progression is consistent with gold's recent behavior, where price advances through defined resistance zones over time. Gold holds structure as long-term targets remain open, and the current setup reflects that same dynamic.
Where the Gold Structure Begins to Fail
The setup is conditional. A break below $4,594 would weaken the structure and shift the market into a different phase. Failure to hold this level could lead to resistance above, movement into lower-liquidity areas, or consolidation before any sustained move develops.
If $4,594 breaks, the market enters a different phase - resistance builds above and buyers lose their footing.
This aligns with typical gold behavior around key zones, where losing support changes directional bias rather than immediately triggering a trend reversal. For now, gold remains supported - but not yet confirmed. The market is holding structure while waiting for a decisive move in either direction.
 Usman Salis


