 Eseandre Mordi

⬤ Gold broke below the $5,000 level on the hourly chart, triggering a wave of selling that pushed price into the $4.90x zone. Price briefly recovered from $4.907, but the overall structure still shows lower highs and lower lows. Gold is trading below both the descending trend line and the 200-hour moving average — two classic signs of weak short-term positioning.
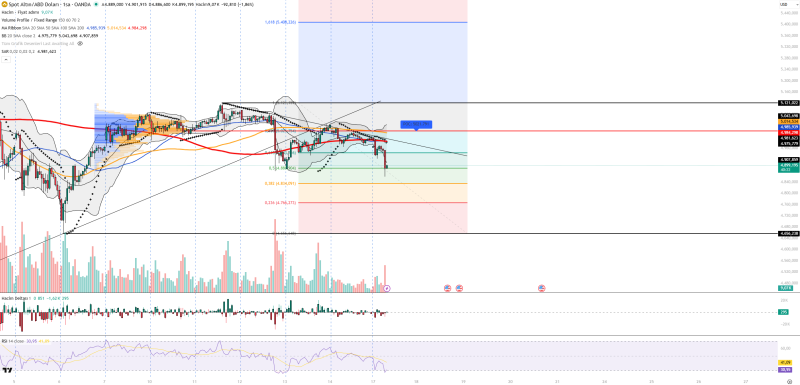
⬤ The technical picture backs up the bearish read. RSI is hovering near 31, close to oversold but not yet triggering a reversal signal — just enough room for a quick reaction bounce. Selling volume spiked during the drop, pointing to distribution rather than any kind of accumulation. The volume profile puts the point of control around $5.021, which now acts as a key resistance. Bollinger Bands widened after price broke below the lower band, confirming volatility expansion, and the Parabolic SAR remains above price.
⬤ Key levels to watch: support sits at $4.907, $4.886, $4.834, and $4.766. Resistance is clustered at $4.959, $4.984, $5.014, and $5.121, with the $4.95–$4.98 band acting as the first ceiling to break. Volume delta stays negative, reflecting continued aggressive selling. The move fits neatly into the broader pattern seen in XAU/USD falls sharply toward key support levels and Gold stalls near $4,900 as rebound faces technical resistance, where dollar strength and rising bond yields keep pressure on precious metals.
⬤ Gold remains sensitive to macro signals. Stronger U.S. data or rising rate expectations would likely extend the downside, while a shift toward risk-off sentiment could spark a temporary bounce. For now, any recoveries look more like corrective moves within a bearish trend — a dynamic similar to what played out in Gold tests $4,800 support as triangle pattern forms.
 Eseandre Mordi


