 Saad Ullah

The structure is clearly defined. As Allie—analyst noted, short-term support sits at 4,690-4,700, with deeper support at 4,625-4,630, while resistance stands at 4,748-4,765. The chart reflects this range-bound behavior, with price repeatedly reacting to these levels without breaking out.
A Gold Range That Continues to Contain Price
The chart shows gold consolidating after a prior upward move, with price repeatedly failing to hold above the 4,748-4,765 resistance zone. This area aligns with a visible supply region where multiple rejections have occurred.
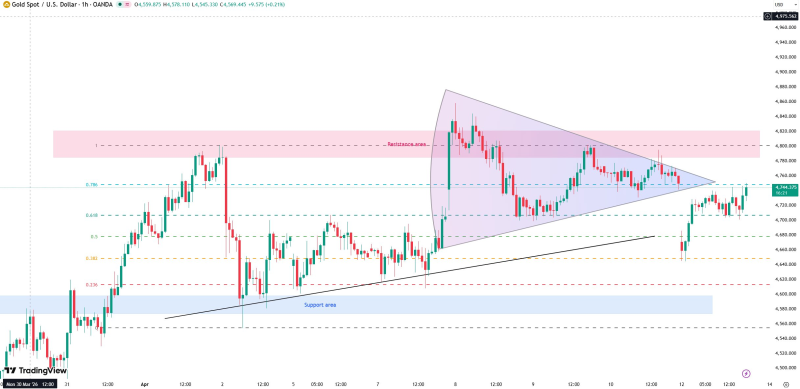
On the downside, the 4,690-4,700 band acts as immediate support, with price bouncing from this zone several times. Below that, the 4,625-4,630 region stands out as a stronger structural base - matching the lower support referenced in the source.
Gold Holds $4,600 Support and Tests $4,700 Resistance Again captured an earlier iteration of this same range dynamic at slightly lower levels, showing how gold has been constructing a series of support-and-resistance interactions as it works toward a resolution.
The Gold Compression Traders Are Watching
A key feature on the chart is the tightening price structure. Lower highs are forming beneath resistance while higher lows are building above support - signaling compression rather than trending behavior. The market is coiling within defined boundaries:
- Repeated rejection at 4,748-4,765
- Consistent defense of 4,690-4,700
- A deeper support layer at 4,625-4,630
Gold Tests Key Resistance at 4750-4800 as Breakout Decision Looms documented the earlier approach to the upper boundary of this range, showing how the 4,750-4,800 zone has been absorbing selling pressure across multiple tests - and why the repeated rejection matters for how the eventual breakout or breakdown gets interpreted.
Why This Gold Range Matters Now
From a structural standpoint, gold is not trending - it is stabilizing within defined boundaries and building pressure for the next directional move. The chart does not confirm direction, only that the compression is advancing.
A move above 4,748-4,765 would shift the structure toward a higher-high formation. A break below 4,690-4,700 would expose the deeper 4,625-4,630 support zone. Until one of these levels gives way, the market remains range-bound.
Gold Compresses Below $4,700 Highs as Triangle Breakout Looms reinforces the compression dynamic from a triangle pattern perspective, showing how the tightening structure visible in the current setup fits into a broader pattern of gold coiling before a directional expansion.
The current phase is less about direction and more about preparation - and the tightening structure suggests that preparation is advancing toward its conclusion.
 Saad Ullah


