Peter Smith

Gold is approaching a critical technical moment. The metal could reach $7,000+ by July 2026, as noted by Rashad Hajiyev, with the current advancing cycle already underway. The chart reflects this outlook, showing price consolidating within a narrowing structure after a strong upward move.
The Gold Uptrend That Has Not Broken
The broader structure remains clearly bullish. Price continues to respect a rising trendline, forming higher lows across the entire move into 2026. Even after a sharp pullback, gold held above this trendline and rebounded, maintaining the integrity of the trend. This behavior confirms that the market is not reversing, but stabilizing within an ongoing upward structure.
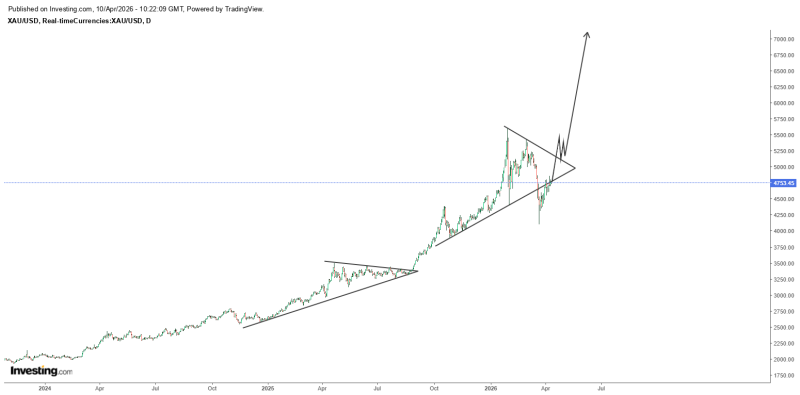
The current price area near $4,700-$4,800 acts as a key pivot where price repeatedly reacts, reinforcing its importance within the formation.
Gold is on track for $7,000+ by July 2026, with the advancing cycle already in motion and price structure confirming every step of the move.
XAU/USD Compression Near Highs Signals Tension
The chart shows gold tightening into a triangular pattern, where descending resistance meets rising support. This type of structure reflects compression - price is being squeezed into a smaller range before a major move. Gold is compressing inside converging trend lines, forming a triangular structure that historically precedes sharp directional expansions.
Key characteristics of the current formation:
- Rising trendline acting as support
- Descending resistance limiting upside
- Price narrowing into an apex
This compression suggests that volatility is being stored, not released. The setup in Gold Caught Between Trendline Support and $5,250 Resistance reinforces the same picture - gold remains pinned between rising support and a firm ceiling, building energy for the next leg.
When gold compresses like this, the breakout that follows tends to be proportional to how long the squeeze lasted. The longer the coil, the sharper the expansion.
Gold Breakout Path Toward $7,000+
The projected move shown on the chart points to a breakout above the descending resistance, followed by continuation to new highs. Breakout structures in gold often emerge after consolidation phases, with tightening ranges preceding stronger directional moves once key levels are taken out.
The upside scenario remains valid as long as price holds above the rising trendline. A confirmed breakout would signal continuation of the broader trend, consistent with projections targeting the $7,000+ range - a scenario detailed in Gold Price Prediction: XAU Breakout Could Target $7,000-$8,000 by May 2026, where similar compression patterns point to expansion.
The $7,000 target is not a guess - it is the measured extension of the current structure. Once this compression resolves, there is very little technical resistance standing in the way.
Broader trend continuation scenarios are outlined in Gold Targets $7K-$8K After Channel Break in 2026, reinforcing the view that the structural setup remains firmly bullish and the breakout case is building with each passing session.
 Peter Smith