Peter Smith

⬤Gold has entered a decisive bearish phase after losing the $5,000 psychological level with strong downside momentum. Price broke its ascending support trendline and slipped below the 50-day EMA, with the daily chart confirming the shift as gold now trades near the $4,500 area following a sharp decline.
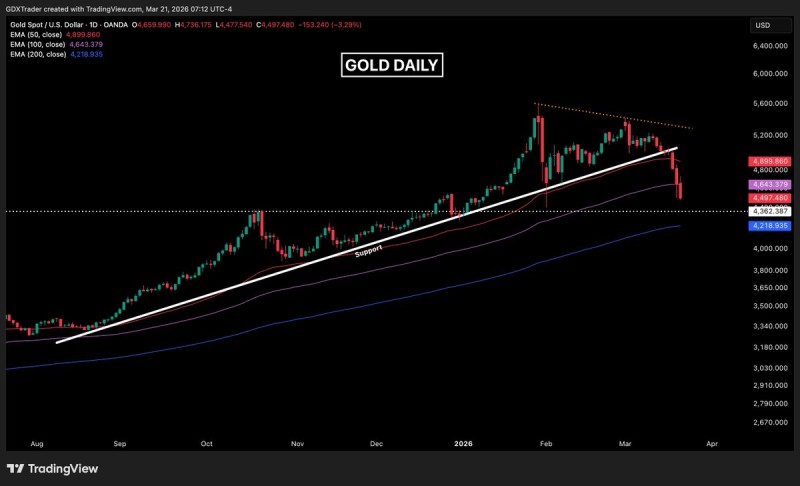
⬤The breakdown is reinforced by consecutive bearish candles that followed the initial drop. The ascending trendline that had guided the prior uptrend has been clearly breached. Gold Faces Pressure as Bearish Patterns Emerge details the breakdown structure and key levels that preceded this move. Gold is now trading below both the 50 EMA and 100 EMA, with the 200 EMA sitting near $4,200 as a longer-term support marker.
⬤Current price action is directed toward the $4,300-$4,400 demand zone, a region where market structure has historically reacted. Gold Price Declines After Reaching 2025 Highs covers the correction dynamics and earlier resistance behavior in this range. The zone acted as a critical level during prior corrective phases, and sellers currently remain in control of short-term momentum.
⬤This development marks a clear structural shift from bullish continuation to corrective territory. The loss of multiple support levels in succession signals a change in short-term market dynamics. Whether gold finds a floor at $4,300-$4,400 or breaks further will depend on how buyers respond as price enters this historically significant zone.
 Peter Smith