Marina Lyubimova
A historic break has emerged in inflation data, with gasoline CPI recording a monthly increase unlike anything seen in the prior 59 years. The chart shows 708 monthly observations - and none of them reached a 25% jump in a single month until the latest print. As Katusa Research put it, that makes last month's move a true outlier rather than just another volatile energy reading.
A Gasoline CPI Threshold That Never Broke Before
The visual setup is simple but powerful. For decades, monthly gasoline CPI changes swung above and below zero - sometimes sharply - but prior peaks stayed below the latest surge. The new spike rises into the +25% area and stands alone at the far right of the chart, clearly above the historical cluster of prior extremes.
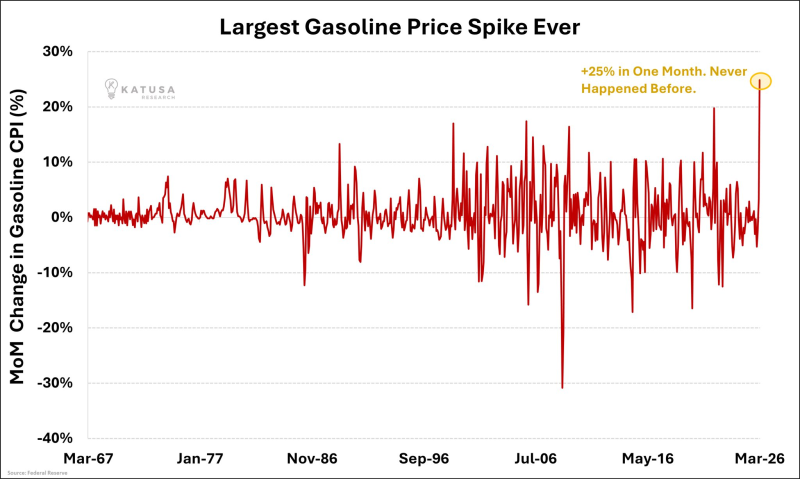
That is the core signal: not a gradual trend higher, but a single reading that breaks the old upper boundary of the dataset. In chart terms, this is less a continuation than a statistical rupture.
Why the Gasoline CPI Move Looks So Unusual
What makes the chart striking is the contrast between past volatility and the current print. Previous spikes were large - but they remained within a recognizable historical band. The newest move breaks out of that band entirely.
That matters because gasoline has an outsized ability to shape short-term inflation expectations. WTI Oil Holds Near $100 - US CPI Could Hit 3.3% showed how quickly elevated oil prices feed into broader CPI pressure - and the gasoline CPI reading now arriving on top of that backdrop intensifies the macro inflation signal considerably.
US Gasoline Prices Hit $3.72 as Truflation Launches New Daily Index provides an earlier reference point for how gasoline price movements were already being tracked in real time before this monthly print arrived - making the scale of the +25% reading even more jarring against that backdrop.
The Gasoline CPI Data Point Markets Will Keep Coming Back To
This chart does not show a pattern that built slowly over time. It shows a range that held for decades, then failed all at once:
- 708 monthly readings stayed below +25%
- The latest print reached that mark first
- The move stands apart from earlier spikes rather than blending into them
Inflation Rebound Signals New Risk as US Rate Hits 1.77% captures the broader inflation rebound context that makes a +25% monthly gasoline spike particularly poorly timed - arriving at a moment when inflation expectations were already shifting higher across multiple data sources simultaneously.
 Marina Lyubimova