Peter Smith
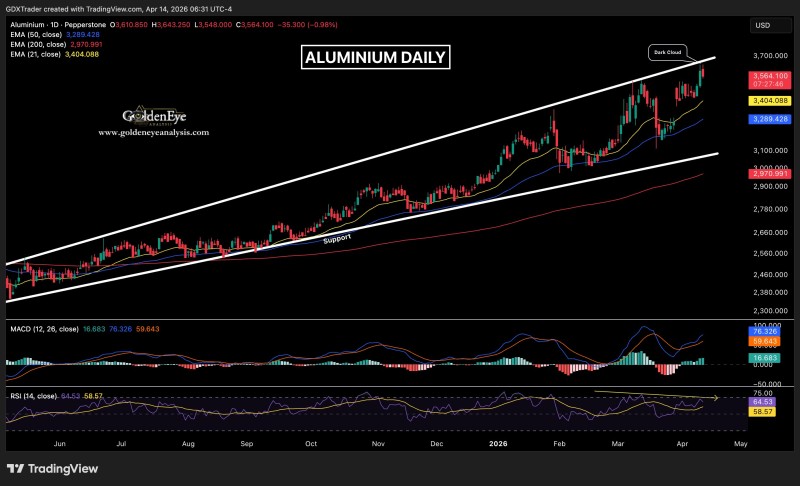
Aluminium is still trading within a well-defined rising broadening wedge, and the larger structure remains bullish for now. But the latest push into the upper boundary of that pattern has started to lose conviction. As noted by $Trader, the combination of a resistance test, a developing dark cloud cover candle, and bearish RSI divergence suggests buyers may be losing momentum right where late longs are most tempted to chase strength.
The daily chart still shows aluminium holding above its 21-day, 50-day, and 200-day EMAs, which keeps the broader trend firmly constructive. The wedge itself reflects expanding volatility rather than a broken trend, and price is still trading near the upper end of that long-running rising structure.
The market has not actually lost bullish structure. What has changed is the quality of the move into resistance.
That matters because the latest candles are no longer advancing with the same clean momentum seen earlier in the rally. That shift often tells a more important story than the headline price alone.
Aluminium Candle at Resistance Is Changing the Tone
The immediate warning comes from the candle formation at ascending resistance. A dark cloud cover is forming just as price presses into the top of the wedge, and that does not confirm a reversal by itself. But in this location, it signals that sellers are beginning to respond more aggressively at a level where aluminium had previously enjoyed relatively smooth upside progress.
Aluminium Price: Evening Star at 3,340 Signals Potential Pullback examines another resistance rejection in aluminium with an overextended momentum backdrop - a closely related setup worth reviewing alongside the current picture.
In practical terms, this is the kind of formation that often marks the start of consolidation or a retracement rather than a fresh breakout. The location of the rejection is what gives it weight.
Sellers are beginning to respond more aggressively at a level where aluminium had previously enjoyed relatively smooth upside progress.
Aluminium RSI Divergence Undermines the Latest Push Higher
The second warning is underneath price. RSI is no longer confirming the latest highs, even as aluminium pushes into resistance. That bearish divergence is one of the clearest caution signals on the chart because it suggests the rally is still advancing, but with less internal strength behind it.
The broader takeaway is straightforward:
- The uptrend is still in place
- Resistance is now being tested at the top of the wedge
- Momentum is fading rather than strengthening
That combination does not invalidate the bullish trend. It does, however, make this a less attractive place to add risk.
Aluminium Holds Key $2,600 Support as Weekly Channel Pattern Signals Continuation looks at the same metal from the trend-continuation side, with price holding above major moving averages - useful context for understanding where the structural floor currently sits.
The structure still favors higher prices over the long run unless key support breaks, but the odds from here look more consistent with a pause, sideways reset, or pullback before any sustainable continuation higher.
The structure still favors higher prices over the long run, provided key support holds. But from the current position at the top of the wedge, the probabilities lean toward a pause or pullback before any sustainable move higher can develop.
 Peter Smith