 Usman Salis

⬤Shares of ZETA are consolidating just below a key resistance zone near $22 on the two-week timeframe. The chart shows a prolonged sideways phase after a strong rally earlier in the cycle. According to Fibonacci_TA, the bullish setup remains intact but will only activate once price closes convincingly above the $22 level. Until that happens, the stock is stuck in a holding pattern.
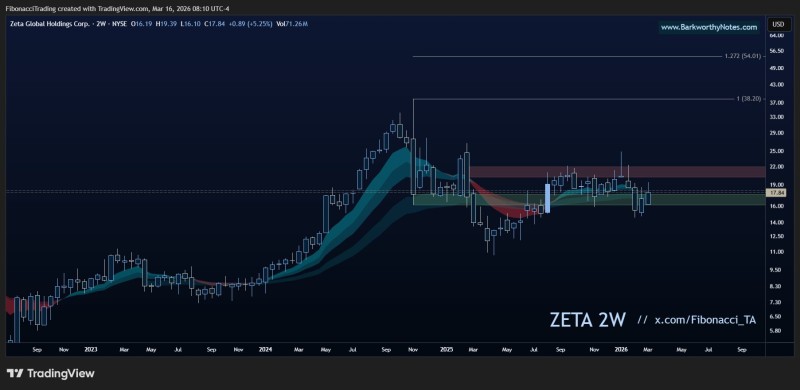
⬤ZETA ran hard through 2024 before stalling out and entering a well-defined trading range roughly between $16 and $22 throughout 2025 and into early 2026. The green support band around $16-$18 has continued to attract buyers, while the red resistance zone near $21-$22 keeps capping any recovery attempt. As noted in ZETA Stock Consolidates Between $15 and $22 on the Monthly Chart, this range has been the dominant structure for months, with $22 consistently acting as the ceiling.
⬤The next meaningful directional move for ZETA hinges on whether bulls can clear the $22 threshold with conviction. A breakout there would likely signal the end of the current consolidation and a return of broader upside momentum. The same zone was flagged in ZETA Stock Setup: $22.19 Pivot in Focus Ahead of Earnings Volatility as the key pivot determining the stock's next directional leg. If reclaimed, Fibonacci extensions project initial targets near $38, with a longer-term extension toward $54.
⬤Beyond the price structure, technical commentary points to ongoing accumulation near current levels. The $18-$19 zone in particular has drawn institutional attention, as detailed in ZETA Dark Pool: 2.8M Shares Cluster at $18-$19 Price Zone. That kind of demand clustering near support suggests the stock is being quietly absorbed before any potential expansion. The reaction at $22 will ultimately decide whether Zeta Global transitions from consolidation into a renewed uptrend.
 Usman Salis


