Usman Salis
The U.S. stock market has entered uncharted waters. A century-long Bloomberg chart shows equity valuations have climbed to their highest percentile ever recorded—surpassing the peaks of 1929, the late-1960s boom, the dot-com bubble, and the post-pandemic rally. With valuations hovering near the 100th percentile, investors face a market landscape with no historical precedent and few reliable guides. This raises crucial questions about risk, return expectations, and whether American equities can maintain these lofty levels.
What the Chart Reveals
Recent data has sparked widespread discussion about just how expensive U.S. stocks have become. The chart tracks a composite of major valuation metrics—including trailing and forward P/E ratios, CAPE, price-to-sales, price-to-book, EV/EBITDA, Q ratio, and market-cap-to-GDP—spanning from 1901 to 2025. This long-term view shows that current valuations have climbed beyond every previous cycle in modern financial history.
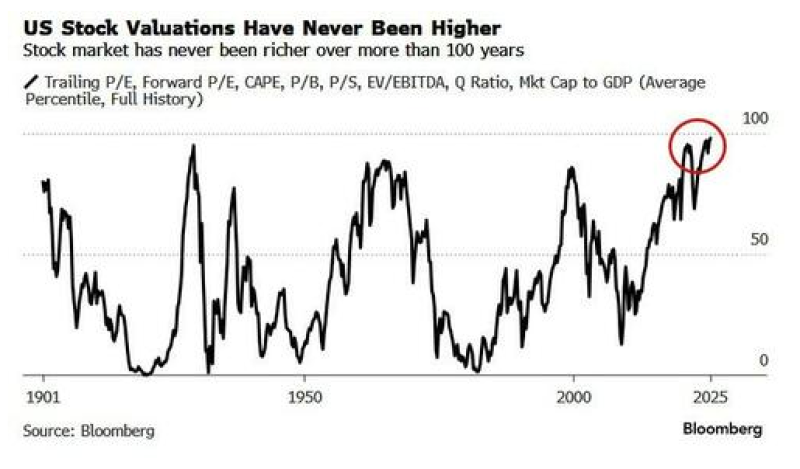
The right edge of the chart shows the composite line reaching its absolute upper limit, marked in the red circle. This isn't just another peak—it's higher than 1929, higher than 2000, and higher than the 2021 post-pandemic surge. What makes this moment truly unique is that all major valuation indicators are elevated simultaneously. The chart also reveals that since the early 2010s, valuations have been trending into a structurally higher range, driven by cheap money, tech dominance, and sustained investor appetite for growth.
Why We're Here
Several forces have pushed valuations to these extreme levels:
- Tech Giants Dominate: The biggest companies—particularly in AI and cloud computing—carry massive valuation multiples that lift the entire market higher.
- Years of Easy Money: Ultra-low interest rates and central bank bond-buying programs inflated asset prices and made high multiples seem normal.
- Growth Obsession: Excitement around artificial intelligence, semiconductors, and digital innovation has kept investors willing to pay premium prices.
- Relentless Capital Flows: Passive index funds and global liquidity have fueled continuous buying, even during uncertain times.
The Risks Ahead
Trading at historic extremes comes with serious downsides. If earnings growth disappoints or interest rates stay elevated for longer, multiples could compress quickly as they revert toward long-term averages. Markets priced this richly are also hypersensitive to shocks—whether from unexpected inflation, geopolitical flare-ups, central bank pivots, or recession signals. History also suggests that buying stocks at extremely high valuations typically leads to underwhelming returns over the next decade.
What It Means for Investors
The message from this chart is unmistakable: U.S. stocks are priced higher than at any point in the past 124 years. While robust earnings, structural tech growth, and optimism continue to support premium pricing, the risks of staying at these levels are impossible to ignore. The key question now is whether the market can hold this altitude or if gravity will eventually pull it back down. The Federal Reserve's next moves and upcoming economic data will likely determine how long this historic peak can last.
 Usman Salis