Saad Ullah

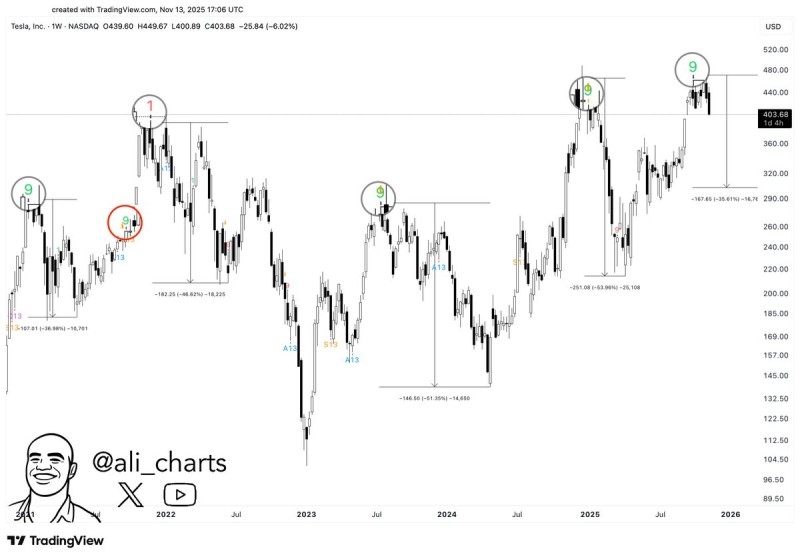
⬤ Since 2021, the TD Sequential has triggered six sell signals for Tesla, and all but one led to meaningful pullbacks. The chart backing this up shows each prior "9" signal appearing near local tops, followed by noticeable declines. The latest weekly signal just printed after a strong rally, with Tesla now turning lower on the chart.
⬤ A fresh sell signal raises typical market concerns: near-term downside risk, potential valuation pressure, and momentum exhaustion—all common when technical reversal indicators pop up. There are no policy-specific risks or regulatory proposals tied to this signal; it's purely about market behavior and chart patterns.
⬤ The TD Sequential's track record on Tesla is why this signal is getting attention. Past instances have been followed by declines marked clearly on the chart with percentage drops. While no specific prediction is being made here, the visual history suggests traders might treat this as a caution flag for short-term positioning.
⬤ For investors, these recurring TD Sequential signals matter because they often show up at turning points or when strong trends start to hesitate. If Tesla follows the script from previous patterns, expect some volatility or a pullback phase. But if the signal doesn't deliver—like that one time since 2021—it could actually boost confidence in Tesla's broader uptrend. Either way, the next few weeks will tell us whether this historically reliable pattern holds up once again.
 Saad Ullah