 Usman Salis
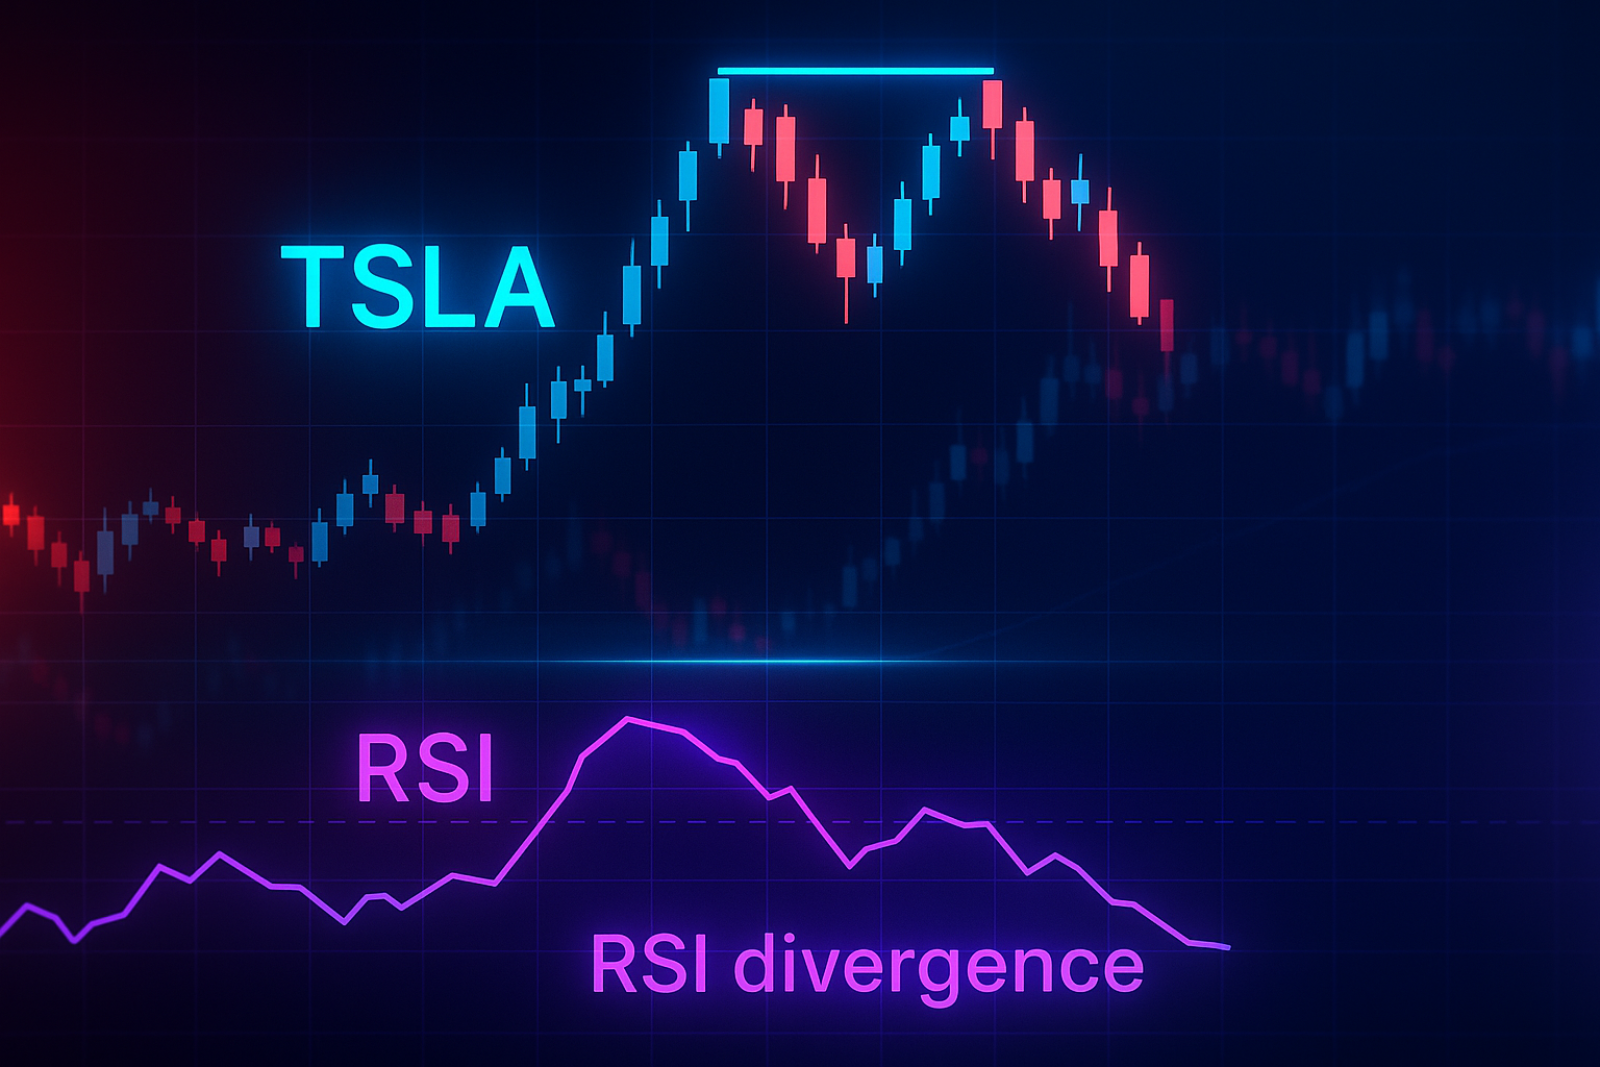
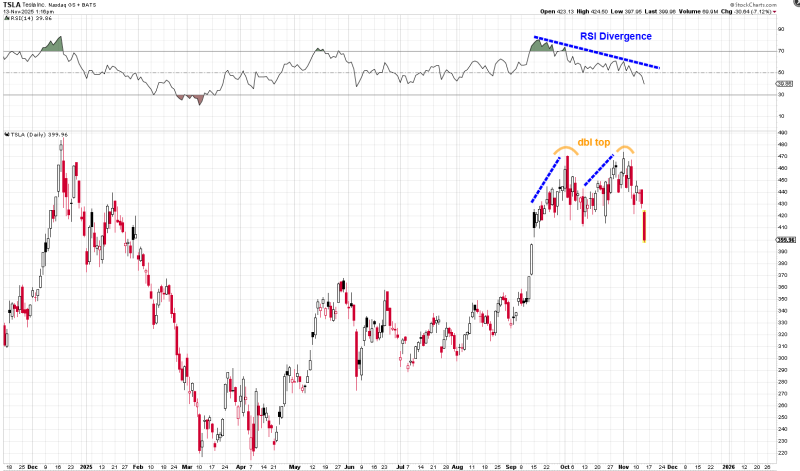
⬤ Tesla (TSLA) was flashing warning signs before its recent decline. The stock formed a textbook double-top structure while the RSI printed lower highs—a bearish divergence that often signals weakening buyer strength. This divergence turned out to be a significant tell, even if it wasn't obvious in real time. Looking back at missed signals like this can help traders spot similar setups down the road.
⬤ When a stock forms a double top while RSI weakens, it's a red flag that momentum is fading during what looks like a strong rally. For investors, this setup carries real risks: sudden pullbacks, failed breakout attempts, and short-term selling pressure. If this pattern spreads across the sector, it can drag down sentiment and increase the odds of a deeper correction.
⬤ The chart tells the story clearly—RSI trended lower even as TSLA's price tried to make a second high. That's classic bearish divergence. The sharp sell-off that followed confirmed the momentum shift was real, not just noise. The indicator was pointing down while price was still trying to climb, and eventually price caught up to what momentum was already showing.
⬤ Now that TSLA is trading lower, traders are watching to see if it can find support at previous levels or if the weakness continues. This episode is a good reminder that divergence patterns can serve as early exhaustion signals. For the broader market, TSLA's reversal raises questions about whether growth stocks can regain momentum without clearer bullish confirmation.
 Usman Salis


