 Usman Salis
⬤ Tesla stock has hit a technically significant spot as TSLA tests its weekly upward trendline—a level that's capped gains all year long. This is the first real attempt in 2025 to push cleanly through this resistance. The weekly chart shows Tesla trading around $450, pressing right up against long-term resistance while still holding a pattern of higher lows.
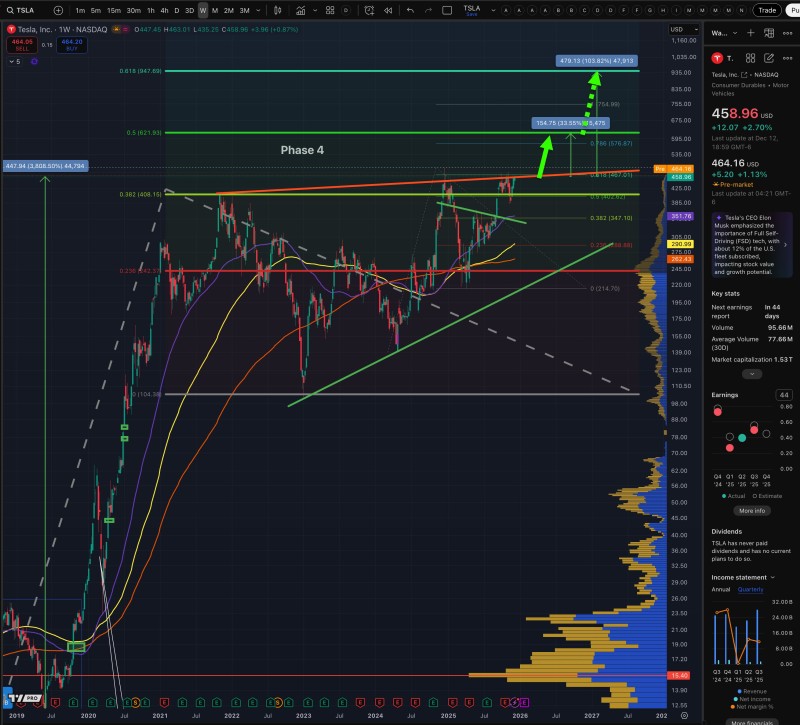
⬤ The chart shows a recovery structure taking shape after Tesla's earlier drop, with price now sitting just below a key resistance band. Several technical pieces come together here: the rising weekly trendline and horizontal resistance in the $460-$480 zone. Previous tries at moving higher got shut down below this area, which makes the current test worth watching. Price is still above rising support, showing buyers are defending higher ground despite the overhead pressure.
⬤ If TSLA breaks above the trendline and holds, the next upside target zone sits between roughly $576 and $615—levels that line up with prior range highs and chart projections. These represent the next major reference points if Tesla can lock in a weekly close above resistance. Until that happens, the chart still shows a transition phase rather than a done deal.
⬤ This matters beyond just Tesla because the stock remains a major influence on sentiment in growth and tech stocks. A sustained move above the weekly trendline could spark stronger momentum across related sectors, while a failure to break higher might drag out consolidation. How TSLA handles this test will likely shape near-term volatility and direction across the broader equity market.
 Usman Salis


