 Saad Ullah

⬤ Tesla stock has staged an impressive comeback over the past ten months, with shares jumping from around $240 on March 24 to close to $500 today. The long-term chart structure that predicted this move has been tracking this recovery for nearly two years. Back in March, when TSLA was trading in the mid-$200s, the price action looked weak to most observers, but the technical setup told a different story.
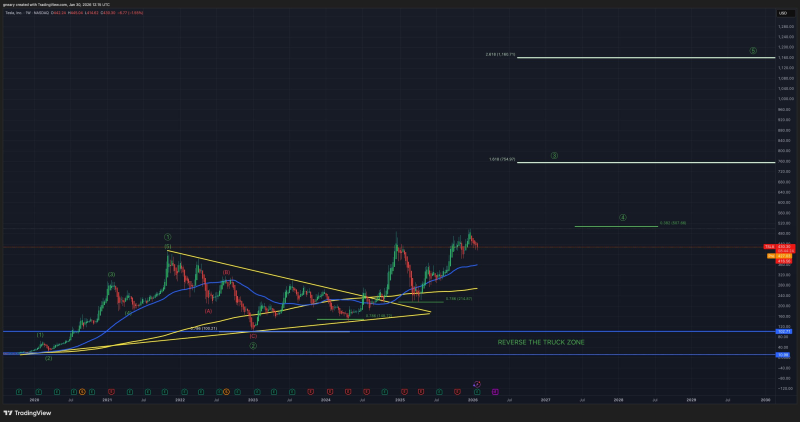
⬤ The chart showed a lengthy consolidation phase that set the stage for what came next. After building this base, TSLA broke out and started climbing steadily, backed by rising trendlines and strengthening momentum. Since that breakout, Tesla has been making higher highs and higher lows—textbook signs that the downtrend was over. The roughly 100% gain from the $240s to current levels speaks for itself.
⬤ The chart includes several technical reference points—reclaimed resistance zones and Fibonacci projections above current price. These aren't meant as short-term price targets, just structural markers showing where the stock might head next. TSLA has pulled back a few times during this run, but those dips stayed within the uptrend channel, keeping the recovery intact.
⬤ This rally matters beyond Tesla itself. As one of the most heavily weighted stocks in major indices and growth sectors, TSLA's performance influences broader market sentiment. The 100% rebound demonstrates how solid technical structures can hold up even when things look shaky, offering clues about how other major stocks might behave as market trends continue evolving.
 Saad Ullah


