 Eseandre Mordi

⬤ Tesla has gone practically nowhere over the past five years. After the explosive 2020-2021 rally, shares settled into a wide range, cycling back toward the mid-$300s again and again. MentoviaX noted that this drawn-out sideways grind has pushed retail traders to the exit, even as the stock quietly holds above its long-term ascending trendline.
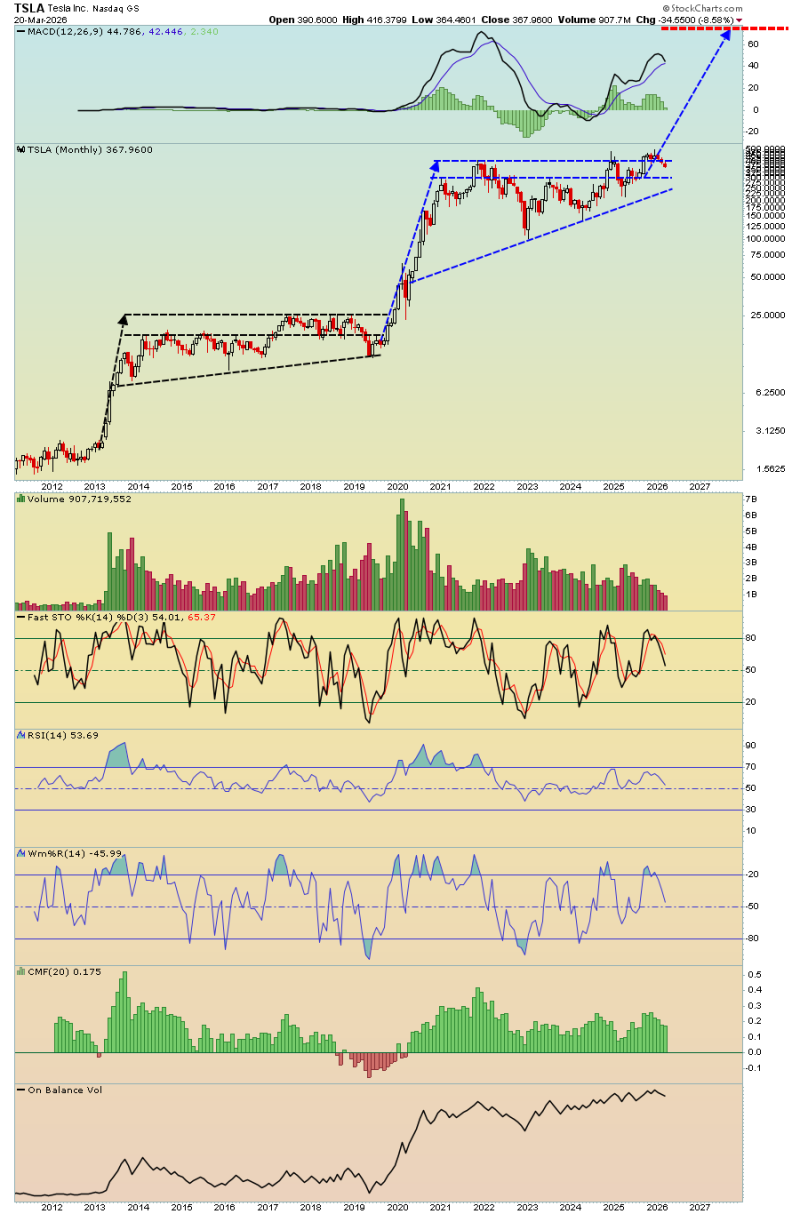
⬤ The chart tells a story of compression. Higher lows keep stacking up along the trendline, but resistance near prior highs keeps blocking any real breakout. That kind of coiling structure is exactly what precedes explosive moves, as seen in earlier setups covered in Tesla Stock Below $364 Resistance, Key Support Levels at $344, $325 and $300 in Focus and TSLA Triangle Tightens Near $395 as Bollinger Band Squeeze Signals Big Move.
⬤ Under the flat surface, momentum looks better than the price suggests. RSI is sitting near mid-levels, and On-Balance Volume has been quietly trending upward, a sign that smart money may be accumulating while retail exits. This same divergence showed up before in TSLA Drops 24% With $361 Support in Focus, where price fell hard but key structural levels held.
⬤ TSLA is now at a decision point. Five years of equilibrium between buyers and sellers has to resolve eventually. A clean break above range highs, or a collapse through support, will define the next major trend for the stock and could shift sentiment across the broader growth equity space.
 Eseandre Mordi


