 Marina Lyubimova

⬤ Tesla's stock is drawing fresh attention after pulling back from higher price zones and settling near important support levels. The recent chart update shows how TSLA climbed into a resistance area before losing steam and sliding back down. Traders are now watching closely to see if the stock can find its footing at these lower levels or if the decline continues.
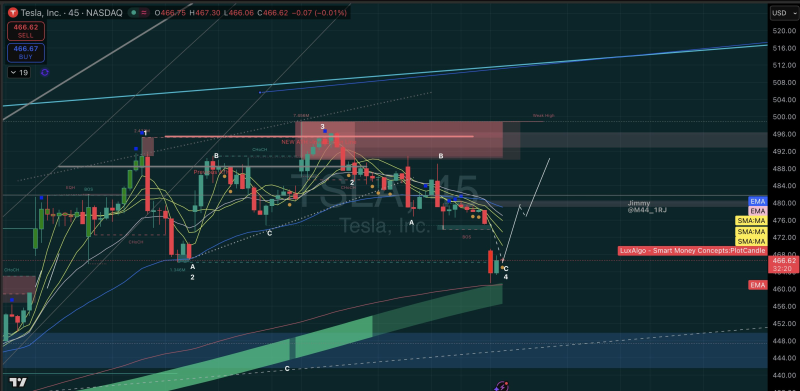
⬤ The technical picture shows Tesla rising into a red resistance zone before momentum dried up. The stock then retreated toward a green support area marked on the chart, with several moving averages tracking the price action along the way. Trading volume shifted during this move, reflecting changing market participation as the stock gave back earlier gains.
⬤ The updated chart points to possible reaction zones if Tesla stabilizes here. Grey areas above current prices mark previous consolidation regions that could come back into play if buying pressure returns. While one visual scenario suggests a potential recovery path, the focus remains on whether the stock can hold support or faces more near-term weakness.
⬤ Tesla's technical structure continues to be a major talking point among traders. With the stock sitting near support on short-term charts and its typically high trading volume, any movement around these levels could shape sentiment heading forward. Market participants are keeping close tabs on whether TSLA bases here or breaks lower.
 Marina Lyubimova


