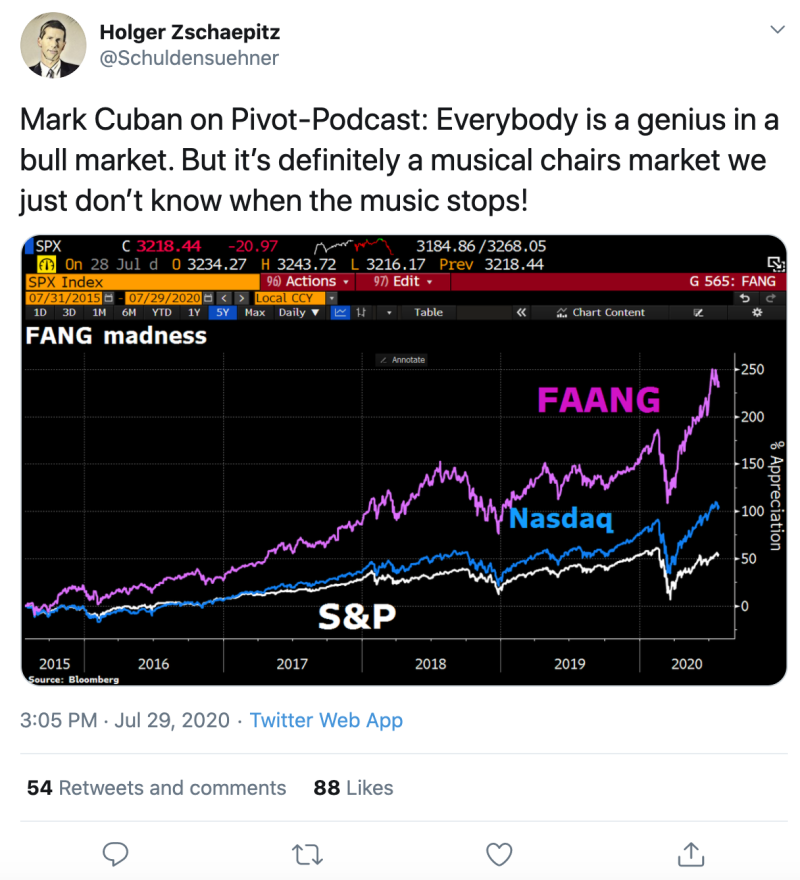
According to Holger Zschaepitz (@Schuldensuehner), S&P 500 and Nasdaq keep rising, however, the ongoing growth may stop, even though it is not clear when this is going to happen.

From a technical perspective, the rise is not about to end. Let's analyze the S&P 500 (SPX) first.
S&P 500

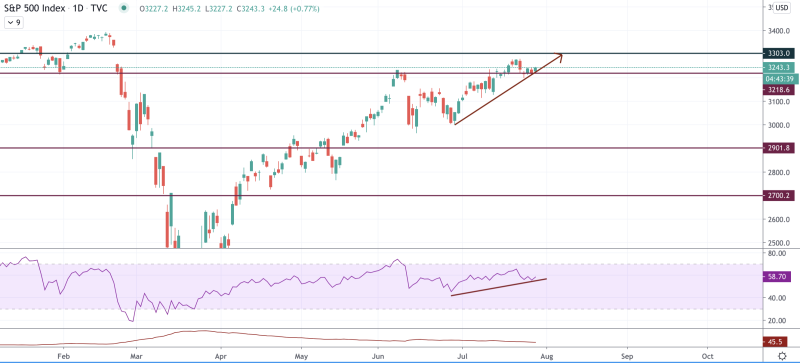
On the daily chart, S&P 500 (SPX) has continued the growth after being corrected to $3,000. The bullish scenario remains relevant until the index keeps trading above the mentioned support. Thus, the bullish RSI indicator considers the further rise to the crucial resistance at $3,000. There are low chances that buyers manage to break it from the first time. That is why traders may expect a false breakout followed by a slight decline.
S&P 500 (SPX) is trading at $3,243 at press time.
Nasdaq 100
Nasdaq 100 is also experiencing the bullish trend, however, its growth has slowed down as the index has shown a spectacular rise over the last time.

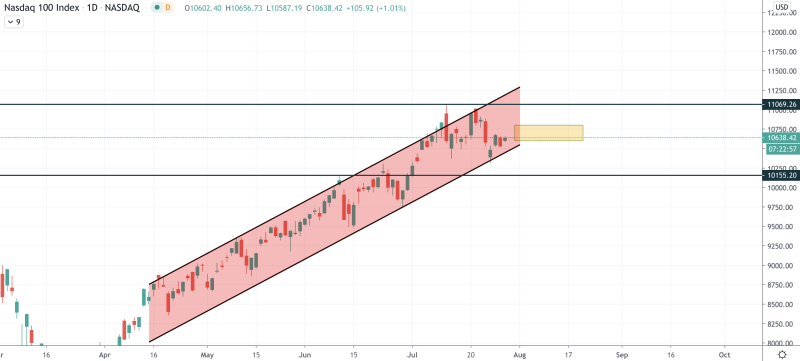
The Nasdaq 100 index has been growing since April of 2020 without any significant corrections. At the moment, it is located in the sideways trading between $10,300 and $11,000. It is unlikely to see a sharp upward trend from the current levels as it has not gained enough power yet. In this regard, this tendency is likely to persist in the range of $10,600-$10,800 and may continue until August of this year.
Nasdaq 100 is trading at $10,644 at press time.
 Peter Smith

 Peter Smith


