Saad Ullah

⬤ Palantir Technologies Inc. is holding up relatively well in the latest session, but the stock continues to face rejection at a key technical barrier near $137. PLTR needs to reclaim both the downward-sloping 20-day simple moving average and a horizontal resistance zone clustered in the same area to strengthen the case that a short-term bottom is forming. The chart shows PLTR last trading near $135.83, with the 20-day SMA sitting around $137.01 overhead.
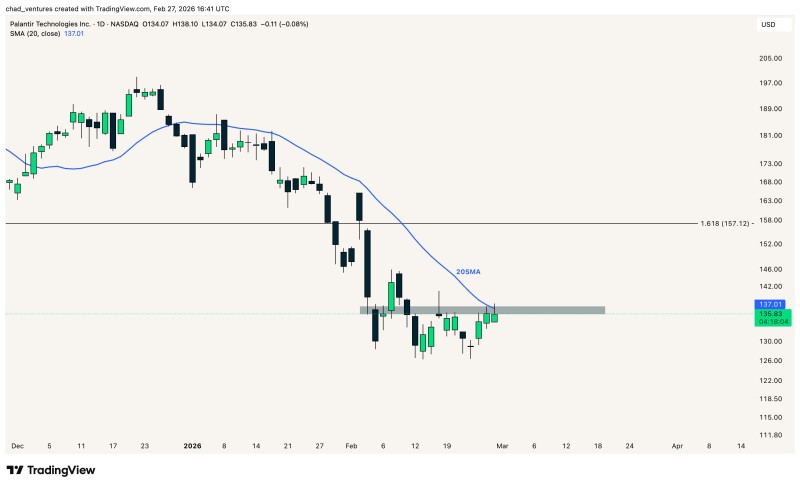
⬤ The image highlights a sharp selloff from the December peak area near the $190s, followed by heavy downside momentum into early February. After the drop, PLTR Stock Trades Below 5 Key Averages Despite Palantir Earnings Jump carved out a base-building range in the low-to-mid $130s, with multiple attempts to push higher stalling into the same gray supply zone. That repeated rejection aligns with the observation that price is still being turned back by the 20-day SMA. At the same time, the moving average is beginning to flatten rather than continue steeply lower, which is often read as a sign that selling pressure may be easing - even if a reversal isn't yet confirmed.
⬤ Technically, the chart marks a clear decision point at $137 - it's both the moving-average ceiling and the top of the horizontal zone. A convincing move above that confluence would increase the possibilities of a rebound toward the labeled 1.618 log Fibonacci level at $157.12. Until that breakout occurs, PLTR Stock Tests Critical Gold Support at Make-or-Break Price Level remains in a recovery attempt that's still constrained by overhead resistance, with the recent range acting as consolidation after the prior decline. This setup matters because it places Palantir at a well-defined inflection area where trend direction often becomes clearer. A sustained push through $137 would shift near-term structure toward higher levels and put the $157.12 marker back in focus, while continued rejection would reinforce the corrective tone established since late 2024. As noted in Palantir Stock Tests $130 Support Zone as Rising Trendline Meets Year-Old Price Level, the stock is navigating critical technical levels that could determine its next major move.
 Saad Ullah